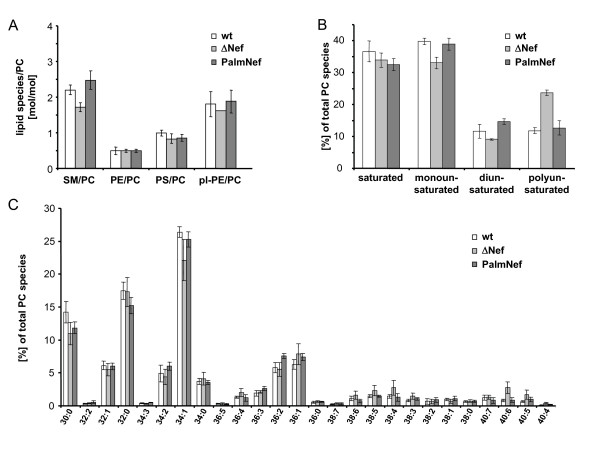
Figure 3.
Lipid analysis of virus particles. Quantitative lipid analysis was performed as described in Methods. Data are displayed as molar ratio of individual lipid classes to PC. Values present the average from at least three independent experiments with error bars indicating the standard deviation of the mean. (A) PC molecular species distribution given in % of total. (B) Number of species in % of total either containing none, one, or two or more than two double bonds in both fatty acids. (C) Analysis of all PC species. X:Y values on the x-axis denote the total number of C- atoms of both fatty acids (X) and the total number of double bonds (Y), respectively.

