Figure 4.
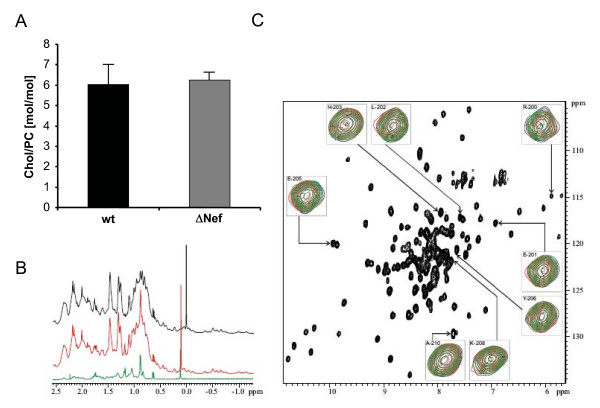
Nef does not affect the cholesterol content of HIV-1 particles. (A) Quantitative lipid analysis was performed as described in Methods. Data are displayed as molar ratio of cholesterol to PC. Error bars represent standard deviation of the mean. (B) Selected high-field region of the1H spectra of 0.4 mM Nef-SF2 (Δ1–43, C210A) in the absence (black) and presence of 0.4 mM water soluble cholesterol (red), in comparison with water soluble cholesterol dissolved in the same buffer as the protein (green).(C) 1H,15N-TROSY-HSQC spectra of 0.4 mM Nef-SF2 (Δ1–43, C210A) highlighting an overlay of the C-terminal residues including the putative cholesterol binding site in the absence (black) and presence of 0.4 mM water soluble cholesterol (red) or 0.4 mM methyl-β-cyclodextrine (green).

