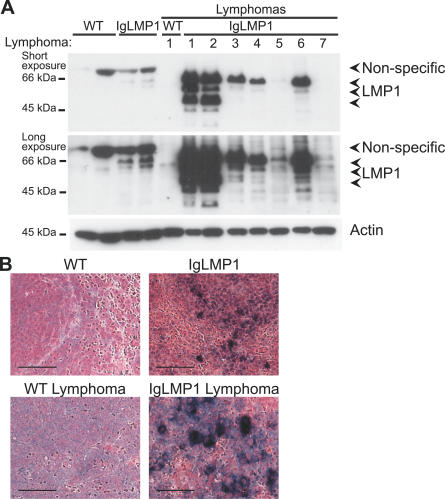
Figure 1. High LMP1 Expression Correlates with the Development of Lymphoma.
LMP1 expression is shown by (A) immunoblotting of purified B cells (CD19+) and (B) immunohistochemistry staining of spleen tissue from wild-type (WT) and LMP1 transgenic mice.
(A) Lymphomas are identified with a number (1–7). Arrows indicate the LMP1-specific band and its degradation products as well as a non-specific band. Actin was used as a loading control.
(B) White and red pulps are shown, but this architecture is lost upon development of lymphoma. Scale bar, 20 μm.

