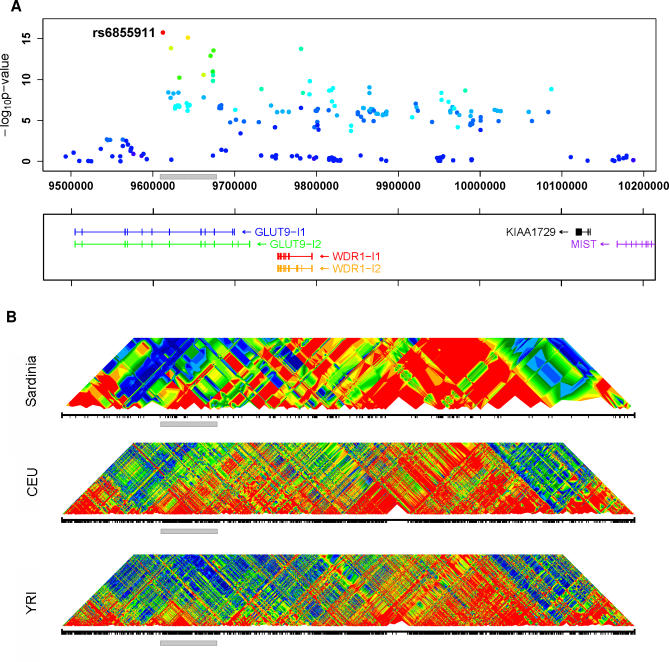
Figure 3. Association Results and Linkage Disequilibrium Patterns in Region Surrounding the GLUT9 Gene.
(A) Summary of the association between SNPs in the region and UA levels. The SNP showing strongest association (rs6855911) is highlighted. Other SNPs are colored according to their degree of disequilibrium with rs6855911, ranging from high (red), to intermediate (green), to low (blue). Transcripts in the region are indicated at the bottom of the graph, with an arrow indicating the direction of transcription.
(B) Patterns of linkage disequilibrium in the region in Sardinia and in two of the HapMap populations (CEU and YRI) [25], where r 2 values are calculated according to [26] and colored as (A). The grey bar marks the region of association and facilitates comparisons between the panels.

