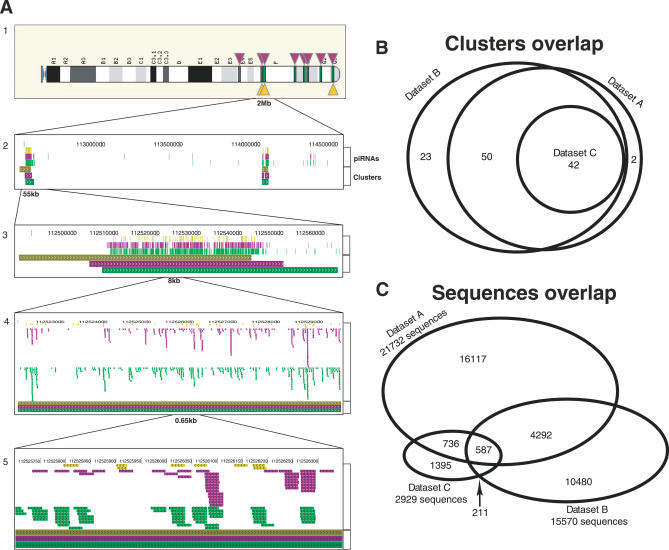
Figure 1. Sequence and Cluster Overlaps between Datasets A, B, and C.
Although the three studies identified the same piRNA clusters, they are distinct at the level of piRNA sequences.
(A) View of Chromosome 5 piRNA sequences and clusters from datasets A, B, C. Top panel (1) is the karyotype view with cluster positions of the datasets: A (green lines), B (top purple triangles), and C (bottom yellow triangles). Lower panels (2–5) are magnified views of the sequences and cluster locations from the three datasets. Top three tracks in each panel are the sequence locations from datasets C (yellow), B (purple), and A (green), and lower three tracks are the cluster positions in the same color scheme. The Venn diagram of the cluster overlaps (B) shows a good agreement between the datasets while sequence overlaps, using 95% identity measure, are small (C). Note that the number of piRNAs used in this comparison is different from the number of sequences reported in the original studies (see Methods and Table S1).

