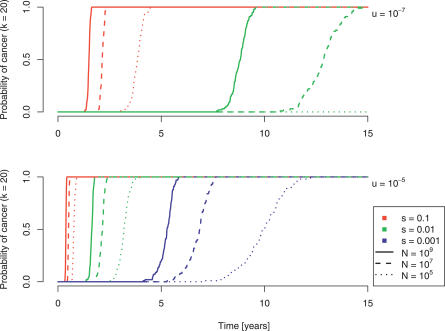
Figure 4. The Probability of Developing Cancer, Defined as the Occurrence of a Cell with Any 20 Mutated Genes Out of 100.
Simulation results are displayed for three different population sizes (109, solid lines; 107, dashed lines; 105, dotted lines), three different selection coefficients (10%, red lines; 1%, green lines; 0.1%, blue lines), and two different mutation rates (10−7, top; 10−5, bottom).

