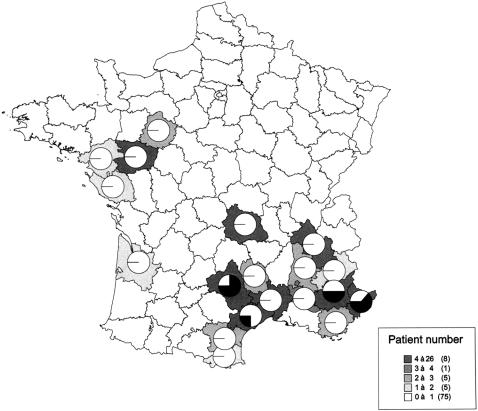
Figure 3. Distribution of classical and neurotoxic cases of envenomation in various regions of France.
Pie charts show the relative numbers of classical (white) and neurotoxic (black) grade 2 and 3 envenomations. The total number of cases reported in each department is presented as grey levels, as indicated in the right bottom end corner of the figure.

