
Figure 2. TEM7 expression in OGS specimens and survival analysis.
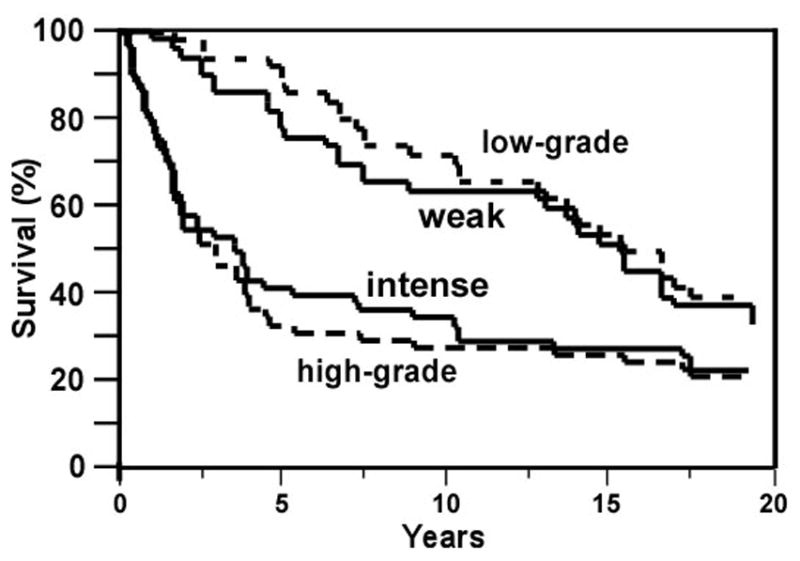
Kaplan-Meier curve comparing the survival of patients with weak staining (grade 0 to 2, marked as ‘weak’) and intense staining for TEM7 (grade 3 to 4, marked as ‘intense’; p<0.04), and with low grade (grade 0 to 2) and high-grade (grade 3 to 4; p<0.03).