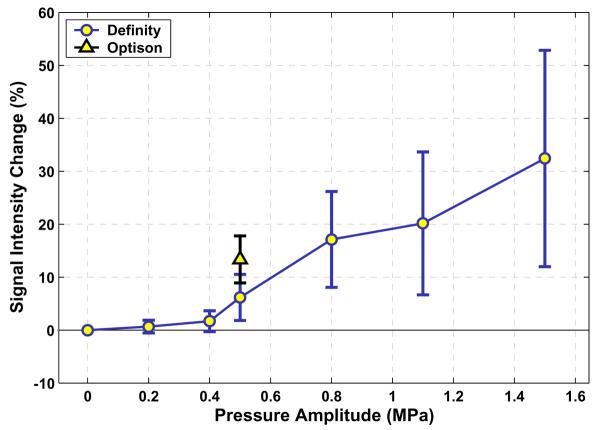
Figure 3.
a): Signal intensity enhancement – measured in contrast-enhanced T1-weighted images – for the six pressure amplitudes tested using Definity. The enhancement for Optison® after sonication at a pressure amplitude of 0.5 MPa is also shown. Mean values (± S.D.) of enhancement at all of the locations at each pressure amplitude are shown.

