
Figure 6. Proteolytic cleavage reveals that contaminating nucleic acid alters the confromation of CREB.
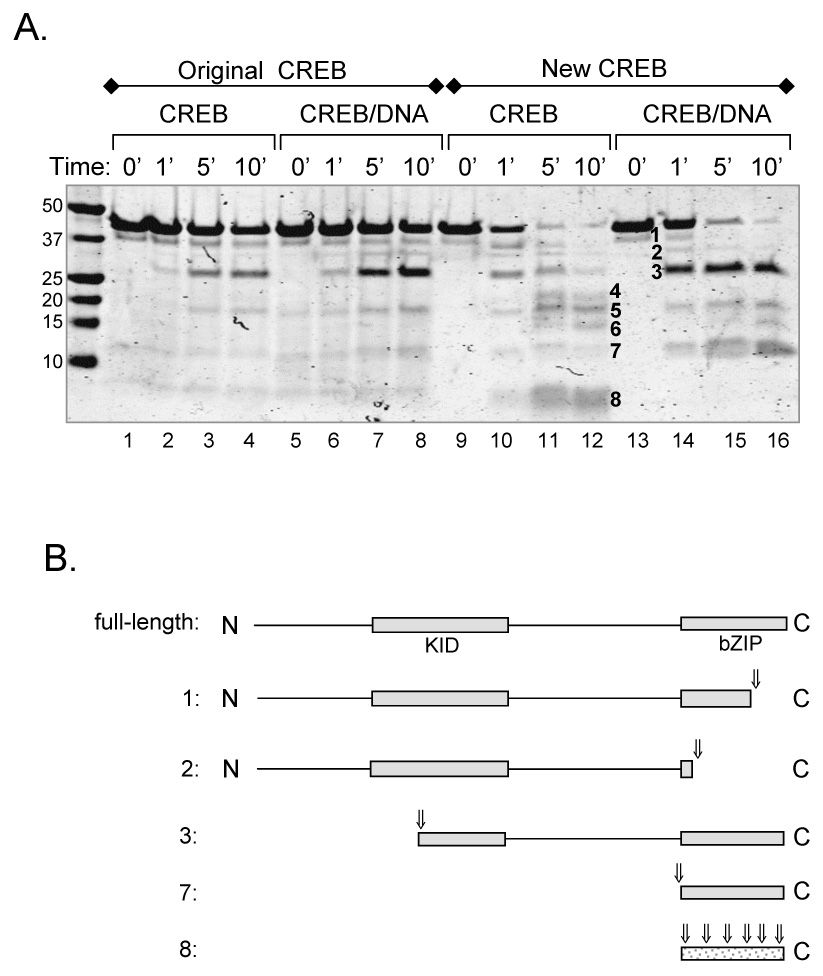
(A.) Original and new CREB in solution and bound to DNA show distinct proteolytic cleavage patterns. All samples were incubated with trypsin (1:100 w/w, trypsin:CREB). Proteins were resolved by 10% Tris-Tricine SDS-PAGE and visualized by Coomassie Brilliant Blue staining. Prominent cleavage products are numbered. (B.) Schematic diagram of CREB cleavage products following trypsin digestion. Numbered fragments correspond to the numbered bands in figure 7A. Assignments are based on sequence information obtained from a subset of cleavage products (bands 1, 2 and 3), coupled with the molecular weights of the fragments and the location of potential trypsin cleavage sites. Arrows represent observed cleavage sites.