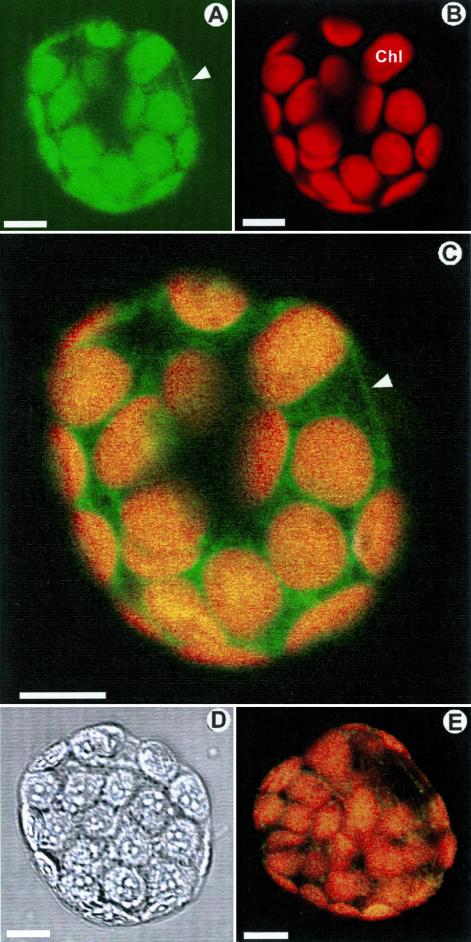
Figure 5.
Immunolocalization of TWD1 in the plasma membrane. (A) Fluorescence of a protoplast from HA-TWD1 plants immunoprobed with anti-HA antibody recorded with FITC filter settings. (B) The same protoplast sample detected with TRITC filter settings. (C) Superimposing of A and B. (D) The same protoplast as in A and B in bright field illumination. (E) Superimposing of fluorescence of wild-type protoplast treated as described A using FITC and TRITC filter settings. Images A–C, and E represent internal optical sections generated by laser scanning confocal microscopy. Note that green fluorescence in the chloroplasts (Chl) is not due to FITC fluorescence but to green coloring of chlorophyll autofluorescence of chloroplasts. Arrowheads mark the fluorescence of the plasma membrane. Bars, 10 μm.

