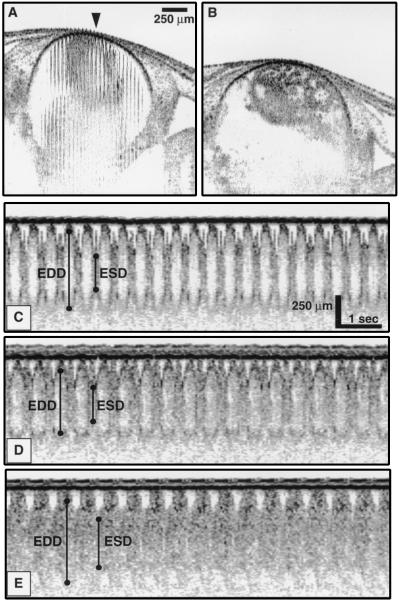
Figure 7.
OCT images and optical cardiograms from an in vivo Xenopus heart. (A) Initial image showing chamber wall movement. (B) Final image of stopped heart acquired 10 min after dose of verapamil. (C) OCT optical cardiogram of a normal, anesthetized specimen. (D and E) Optical cardiograms acquired 1 and 4 min, respectively, after dose of verapamil. Representative bars indicate where end diastolic/systolic dimensions (EDD/ESD) were measured.

