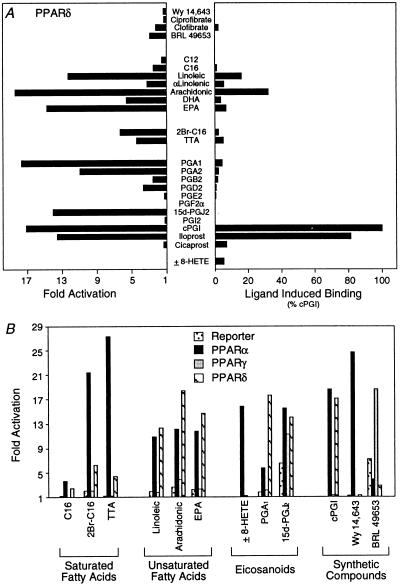
Figure 4.
PPARα/δ and -γ display distinct ligand response profiles. (A) Linoelic acid, arachidonic acid, cPGI, and iloprost transactivate (Left) and bind (Right) to PPARδ. After transfection (Left), compounds were added to cells at the following concentrations: 5 μM Wy 14,643; 100 μM ciprofibrate; 1,000 μM clofibrate; 5 μM BRL 49653; 30 μM C12, C16, linoleic acid, α-linoleic, arachidonic, docosahexaenoic (DHA, all-Z-Δ4,7,10,13,16,19-C22:6), and eicosapentaenoic (EPA, all-Z-Δ5,8,11,14,17-C20:5) acids; 5 μM 2Br-C16; 30 μM TTA; 10 μM PGA1, PGA2, PGB2, PGD2, PGE2, and PGF2α; 3 μM 15d-J2; 10 μM PGI2; 1 μM cPGI and iloprost; 10 μM cicaprost; and 3 μM ±8-HETE. For the ligand binding assay (Right), compounds were added as follows: 5 μM Wy 14,643; 100 μM ciprofibrate; 1,000 μM clofibrate; 50 μM BRL 49653; 30 μM C12, C16, linoleic acid, α-linoleic, arachidonic acids, DHA, and EPA; 10 μM 2Br-C16, TTA, PGA1, PGA2, PGB2, PGD2, PGE2, PGF2α, 15d-J2, PGI2, cPGI, iloprost, and cicaprost; and 1 μM ±8-HETE. (B) Comparison of the responsiveness of PPARα, -γ, and -δ to various compounds. After transfection, cells were treated with the following concentrations of compounds: 30 μM C16; 5 μM 2Br-C16; 30 μM TTA, linoleic, arachidonic acids, and EPA; 3 μM ±8-HETE; 10 μM PGA1; 3 μM 15d-J2; 1 μM cPGI; and 5 μM Wy 14,643 and BRL 49653.

