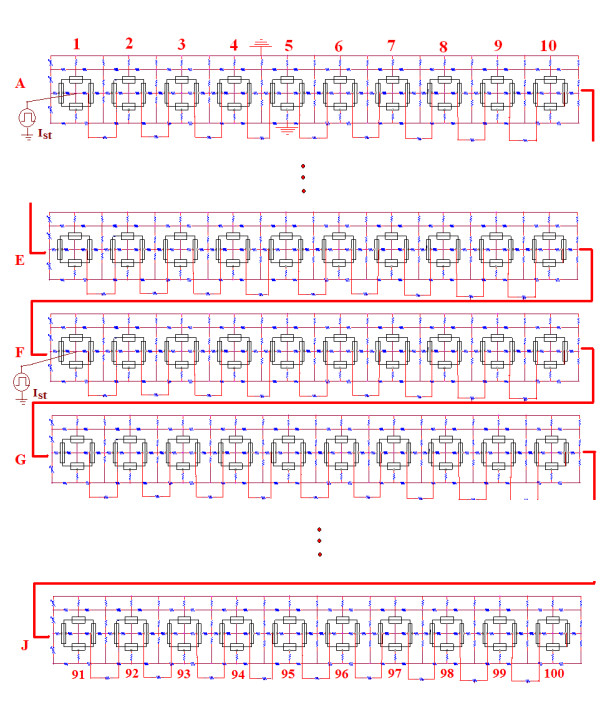
Figure 1.

Schematic diagram for the single chain of 100 myocardial cells. Rows 2 (B), 3 (C), 4 (D), 8(H), and 9 (I) have been omitted in order to contain the size of the figure. For the propagation velocity experiment, cell #1 was stimulated intracellularly with rectangular depolarizing current pulses of 0.1 nA amplitude and 0.25 ms duration. The resultant action potentials (APs) were recorded only from cells 1, 10, 20, 30, 40, 50, 60, 70, 80, 90, and 100 in order to limit the number of traces. For the length constant experiments, intracellular depolarizing rectangular current pulses (10 nA, 5 ms) were applied to cell #51 (middle of chain), and the resulting voltage changes in cell #51 and its immediate neighbors were measured. For this type of experiment, the cells were made inexcitable by removing their GTABLEs.
