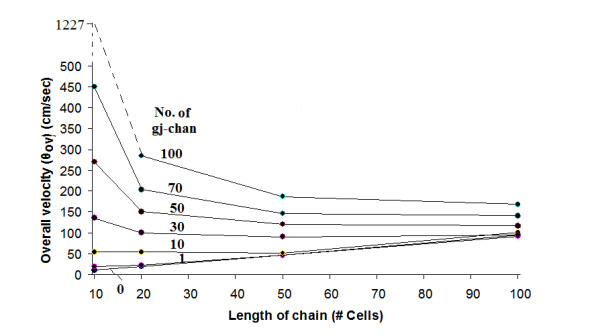
Figure 4.

Graphic summary that quantitates how the overall propagation velocity varies with the length of the single chain. For this experiment, the 100-cell chain was shortened to 50, 20, and 10 cells, so that the results could be reliably compared, and the number of gj-channels in each chain length was varied from 0 to 100. The results show that when there was no or only few gj-channels (namely, 0, 1 or 10), propagation velocity increased with length of the chain. In contrast, when there were many gj-channels (e.g., 30, 50, 70, or 100), the velocity was slowed when chain length was increased, the most prominent effect occurring between chain lengths of 10 and 20 cells. As can be seen, the family of curves tended to converge at the chain length of 100 cells.
