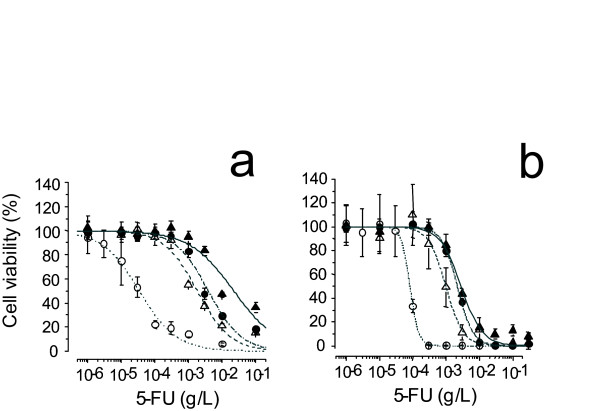
Figure 1.
Growth inhibition curves of L0 (colon26), L0-200, L0-500 and L0-1000 treated with 5-FU. a, Cytotoxic effect of 5-FU was estimated by MTT assay. b, Cell growth inhibitory effects of 5-FU were estimated by CD-DST. Means of L0, L0-200, L0-500 and L0-1000 are represented by open circles, open triangles, closed circles and closed triangles, respectively, the range of S.D. from 6 measurements is indicated by vertical bars

