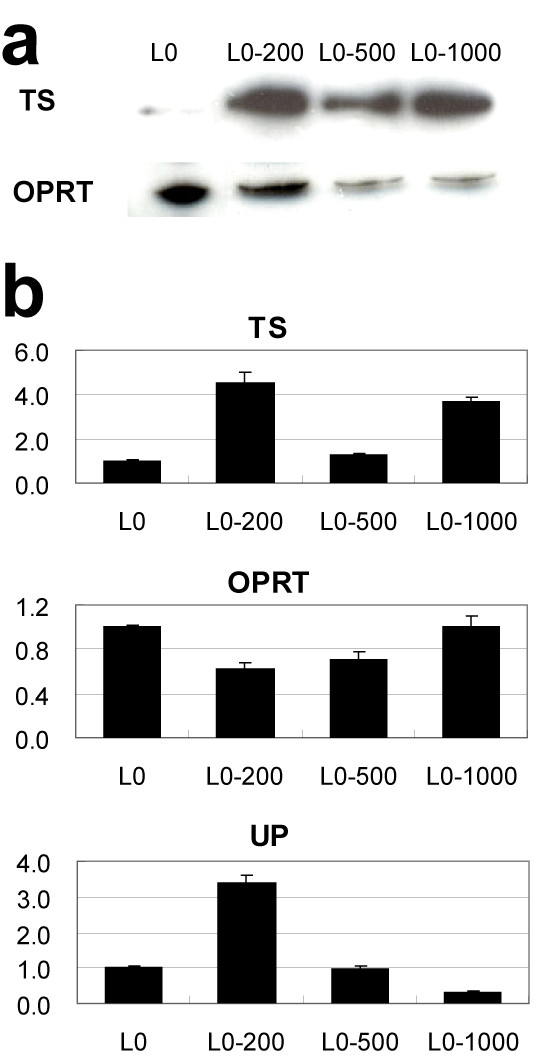
Figure 2.

Changes in 5-FU-related enzymes in resistant sublines. a, Western blotting analyses of TS and OPRT proteins. b, Real-time PCR analyses of TS, OPRT, TS and UP proteins. mRNA expression of each enzyme is shown as the ratio relative to the parental L0 (colon 26) cell. Each column represents the mean with S.D. of 4 measurements.
