
Fig. 4.
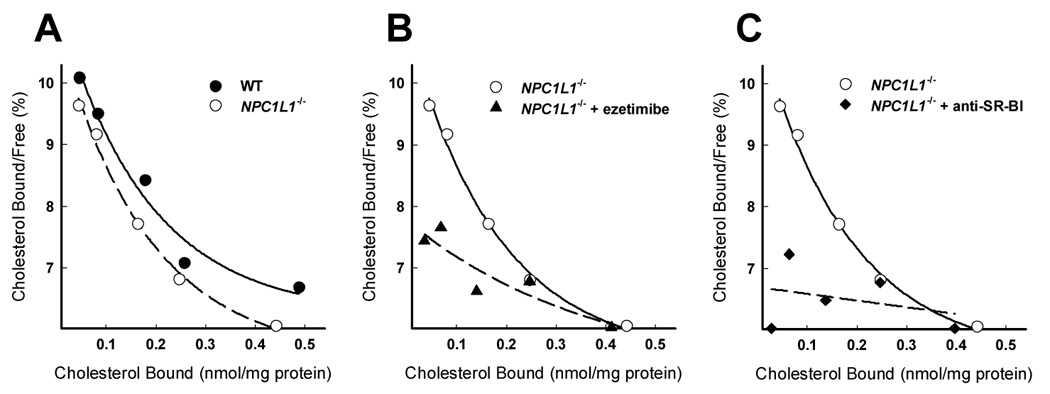
Scatchard analsyis of cholesterol binding to BBMV from wild type (WT) and NPC1L1−/− mice. Cholesterol binding assays were performed with BBMV from untreated NPC1L1−/− mice (A), BBMV from NPC1L1−/− mice treated with ezetimibe (20 µM) (B), and BBMV from NPC1L1−/− mice treated with anti-SR-BI neutralizing antiserum (C). The cholesterol binding curve of BBMV from wild type (WT) mice from Figure 2 is included in A (solid line) for comparison to cholesterol binding of BBMV from NPC1L1−/− mice (hatched line). Cholesterol binding to BBMV from NPC1L1−/− mice is repeated in B and C (solid line) for comparison to the estimated cholesterol association to BBMV from NPC1L1−/− mice treated with ezetimibe or anti-SR-BI neutralizing antiserum (hatched line), respectively. Each data point represents 10 µg of protein from BBMV combined from two mice and representative of 3 or 4 independent repeats each with fresh BBMV preparations from additional animals.