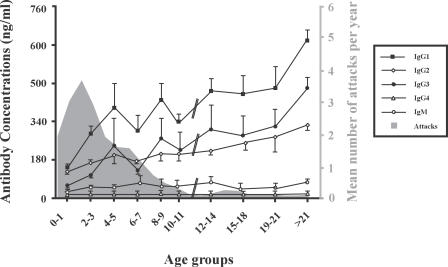
Figure 1. Means and Standard Deviations of Anti-MSP3-b IgG1, IgG2, IgG3, IgG4, and IgM Antibody Responses per Age Group.
Concentrations of antibodies are estimated as described in the Methods section. For each age group the mean number of malaria attacks recorded during the first year of follow-up is indicated by the shaded area. The numbers of individuals in each age group were: 5 (0–1 y), 14 (2–3 y), 17 (4–5 y), 14 (6–7 y), 12 (8–9 y), 13 (10–11 y), 11 (12–14 y), 18 (15–18 y), 13 19–21 y), 100 (>21 y), respectively.

