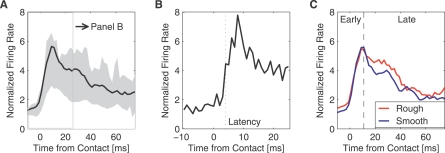
Figure 6. Dynamics of Neuronal Response During Whisker Contact.
Spike times were aligned to the onset of each whisker contact; onset time was set to 0 ms. Touches had a wide range of durations (see Figures 3 and 4) so that response values at progressively later times were gathered from progressively fewer contacts; only 30% lasted longer than 80 ms.
(A) Quartile plot of firing rates. The interquartile range (25% to 75% of neuronal clusters) is shaded gray; the black line is the mean. All clusters were normalized by dividing by their average rates across the whole session.
(B) Magnified view of mean response onset.
(C) Response dynamics separated by texture.

