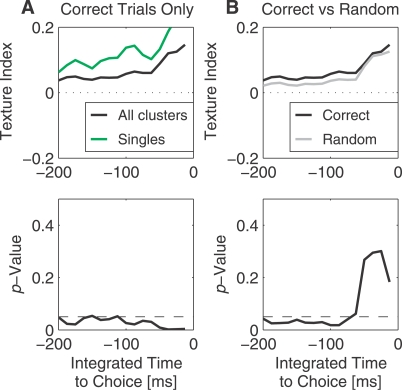
Figure 8. Texture Coding Before Choice.
(A) Upper panel: texture index T calculated for backwards-growing windows from 0 ms (moment of choice) to −t, averaged across correct trials only; Black trace: average across all clusters; green trace: single neurons only; Lower panel: significance of T > 0 for all clusters. The dashed line shows the 5% limit.
(B) Texture index T on correct trials only (black trace, carried over from [A]) versus random trials (gray trace); Lower panel: significance of the difference between correct and random trials.

