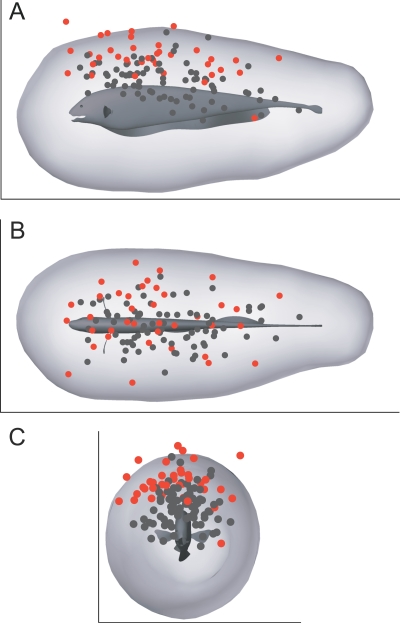
Figure 2. Computed Sensory Volume Overlaid with Measured Detection Locations.
(A) Side view. (B) Top view. (C) Front view. Dots indicate positions of water fleas (D. magna) at the time of detection (in body-fixed coordinates), based on earlier behavioral results [11]. Detections occurring at water conductivities of 100, 300, and 600 μS/cm are shown as black dots (N = 78), whereas detections at 35 μS/cm are shown as red dots (N = 38). The dorsal bias of empirically measured detection points arises from a combination of the search strategy used by the fish and the fact that prey were introduced into the tank from above [11].

