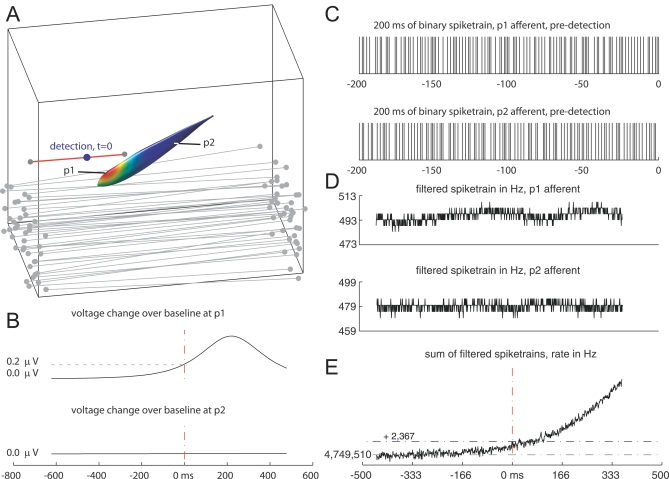
Figure 10. The Process of Estimating the Sensory Volume for Daphnia .
(A) First, simulated prey are moved along forward and backward rays at a speed of 100 mm/s. A subset of the 1,014 forward rays is shown in gray. The red ray indicates a trajectory where prey detection occurred (blue dot, t = 0).
(B) The estimated change in voltage across the skin at p1, induced by the relative motion between the fish and prey, is shown in comparison with the voltage across the skin at p2, further away from the stimulus. Detection occurred in this case with a 0.2-μV change on a 1-mV baseline, a 0.02% change.
(C) A short 200-ms segment of the spike trains corresponding to afferents at p1 and p2.
(D) The spike trains are low-pass filtered to obtain a continuous estimate of spiking rate changes relative to baseline.
(E) On each 1-ms time step, the filtered activity of all afferents is summed. The summed activity is thresholded at a level that gives a 10% false alarm rate over ten repeats (one false detection); the location of the prey at the time of threshold crossing is used to define the detection point. Steps A–E are repeated for each of 1,014 forward rays and of the same number of backward rays to construct a cloud of detection points. These points are then processed to form the SV surface.

