
Figure 1.
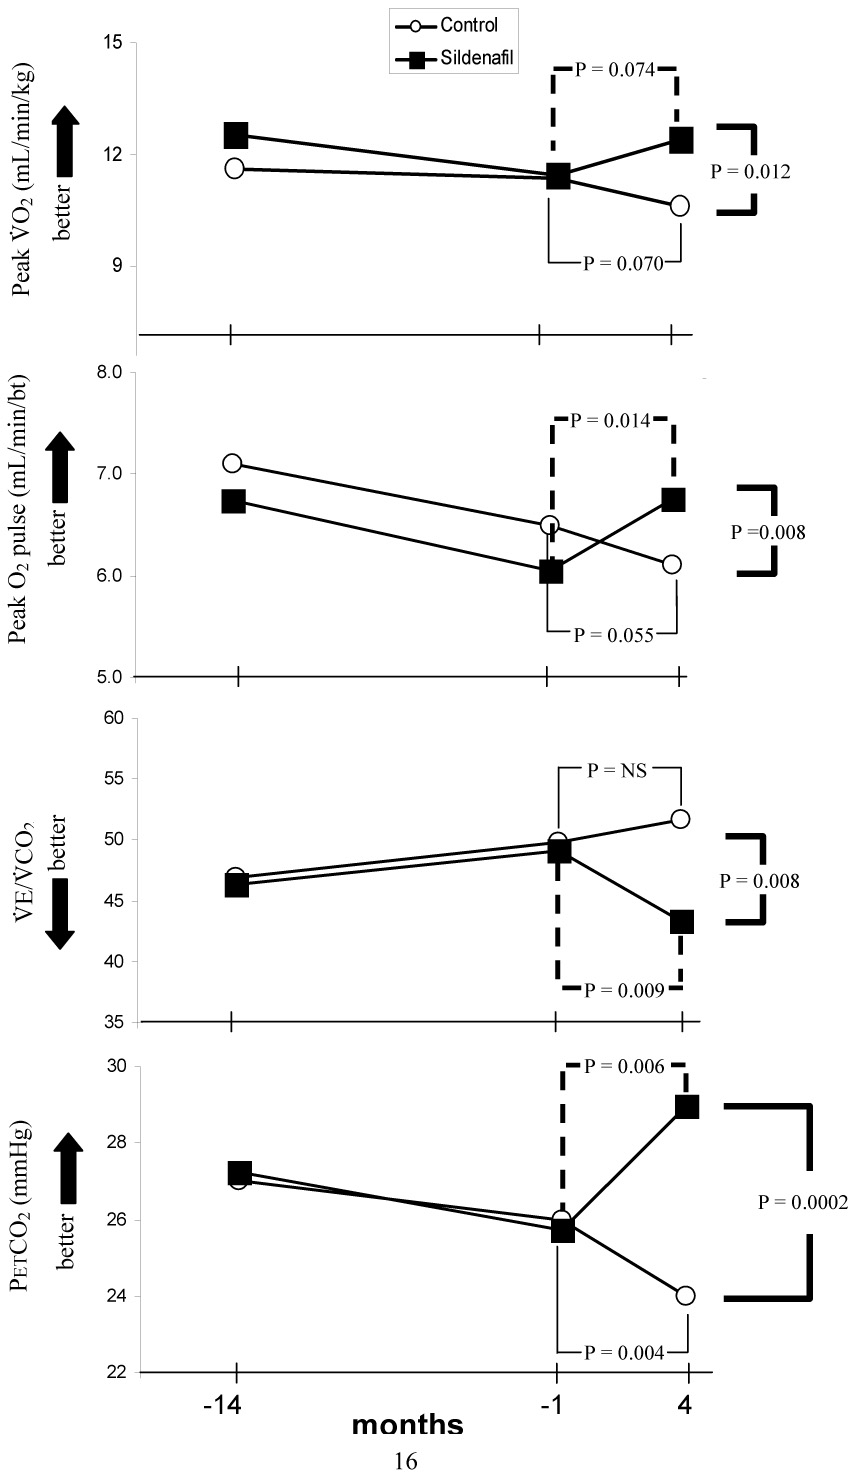
Serial measurements in peak V̇O2, peak O2 pulse, V̇E/V̇CO2, and PetCO2 made at 14 ± 3.2 months and 1.4 ± 0.6 months prior to, and 4 ± 2 months after the start of sildenafil treatment (squares); circles represent control PAH patients treated over a similar time period, but without the addition of sildenafil.
P values are shown for within-group and between group comparisons.