FIG. 8.

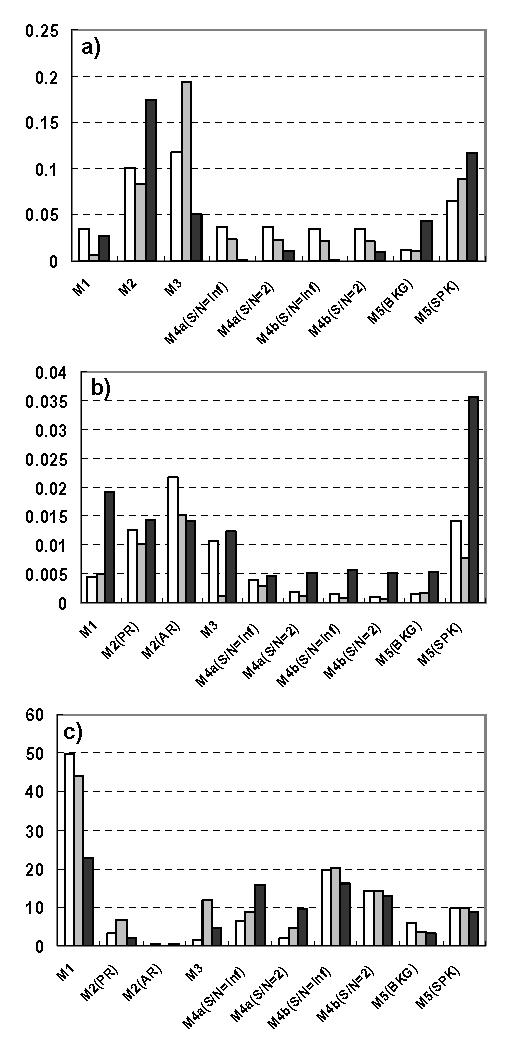
Mean values of (a) MSB, (b) MV, and (c) MRLS for the three categories of methods (white: regression methods, grey: PS methods, and black: GS methods). Note that, inversely to MSB and MV, higher MLRS values indicate better performances.

Mean values of (a) MSB, (b) MV, and (c) MRLS for the three categories of methods (white: regression methods, grey: PS methods, and black: GS methods). Note that, inversely to MSB and MV, higher MLRS values indicate better performances.