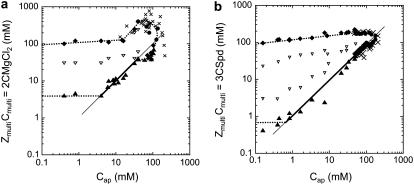
FIGURE 2.
Phase diagrams of NCPs precipitated with magnesium (a) and spermidine (b) in the presence of 10 mM Tris-HCl. They display  as a function of Cap (mM) = 0.799CNCPs (mg mL−1). The positive charge amounts carried by magnesium or spermidine are plotted as a function of the negative charge amounts available on the NCPs. The equations ZmultiCmulti = Cap are indicated by continuous lines. Dashed lines serve as a guide for the eye. Precipitation (▴) and redissolution (♦) points obtained from the precipitation curves are indicated. Above 60 mg mL−1 (Cap = 47.8 mM), the solution state was determined by visual inspection before centrifugation and was either turbid (•) or transparent (×).

