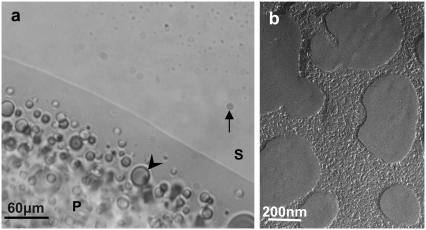
FIGURE 3.
Macroscopic phase separation of NCPs (10 mg mL−1 starting concentration) aggregated by magnesium (20 mM) in the presence of Tris-HCl 10mM, pH 7.6. The phase separation between the supernatant (S) and the precipitated phase (P) was examined by optical microscopy (a) and freeze-fracture electron microscopy (b). The arrow indicates a droplet of the precipitate suspended in the supernatant. Droplets of the supernatant are seen in the precipitate as well (arrowhead).

