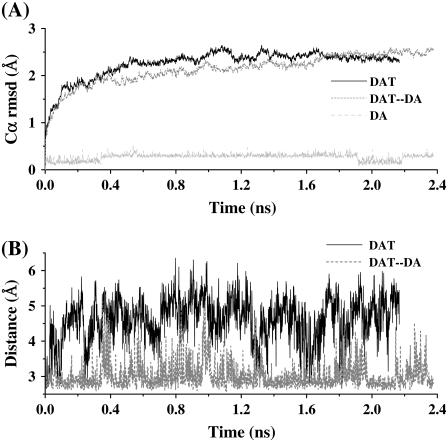
FIGURE 3.
Plots of the Cα RMSD and key distances in the simulated DAT and DAT-dopamine structures versus the simulation time (nanoseconds) during the MD simulations. (A) The DAT Cα RMSD, the Cα RMSD of the DAT-dopamine complex, and the RMSD of dopamine (DA) in the complex. (B) The minimum-distance changes between the positively charged side-chain atoms (NE, NH1, and NH2) of Arg85 and the negatively charged side-chain atoms (OD1 and OD2) of Asp476 in both the DAT and DAT-dopamine complex.

