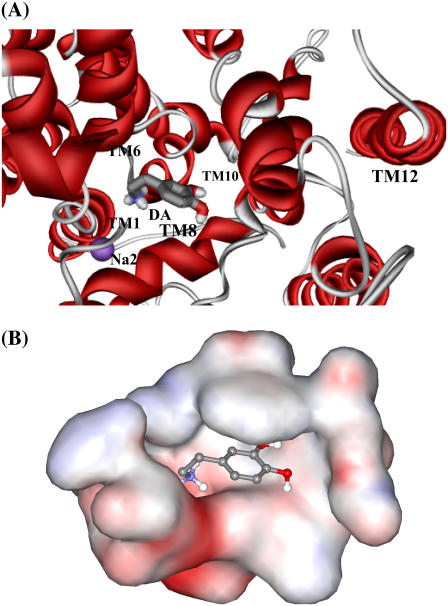
FIGURE 5.
Typical structure of the DAT-dopamine binding complex, which was the 1.50 ns snapshot of the MD trajectory. (A) Viewing the dopamine molecule (shown as ball-and-stick) in the complex model from the extracellular side. Only part of the DAT is shown as ribbon in red, and Na2 as CPK in magenta. Helices 1, 6, 8, 10, and 12 are labeled to indicate the relative position of dopamine in DAT. (B) Viewing the DAT in the binding pocket in the same orientation as panel A. The binding pocket is represented in molecular surface format, colored with electrostatic potentials in which blue is for positive and red is for negative potentials.

