Abstract
Chemical reactions in cells are subject to intense stochastic fluctuations. An important question is how the fundamental physiological behavior of the cell is kept stable against those noisy perturbations. In this study, a stochastic model of the cell cycle of budding yeast was constructed to analyze the effects of noise on the cell-cycle oscillation. The model predicts intense noise in levels of mRNAs and proteins, and the simulated protein levels explain the observed statistical tendency of noise in populations of synchronous and asynchronous cells. Despite intense noise in levels of proteins and mRNAs, the cell cycle is stable enough to bring the largely perturbed cells back to the physiological cyclic oscillation. The model shows that consecutively appearing fixed points are the origin of this stability of the cell cycle.
INTRODUCTION
Noisy fluctuations are inevitable features of chemical reactions in cells, which should lead to cell-to-cell variation in a genetically identical population of cells (1–3). One of the important issues in modern cell biology is how the molecular reaction network bearing such noisy fluctuations produces orchestrated behavior for functioning. In this article, we take the cell cycle of budding yeast, Saccharomyces cerevisiae, as an example and analyze how its dynamics tolerates noise to maintain a coherent cyclic oscillation.
The cell-cycle mechanism is well conserved among eukaryotes (4), where the cyclic ups and downs of activity of complexes of cyclins and cyclin-dependent kinases (CDKs) are at the heart of its dynamics (5). The reaction network regulating the cyclin/CDK activity, however, includes many positive and negative feedback loops, too complex to be verbalized, so that mathematical modeling of the reaction network is necessary (6). Tyson and colleagues have constructed models of the cell cycles of budding yeast (7,8), fission yeast (9,10), and frog eggs (11) by describing networks of reaction kinetics with differential equations. Their model of budding yeast describes the cell cycle as transitions between two stable states (7,8), as has been hypothesized by Nasmyth (12). Li et al., on the other hand, described the cell cycle of budding yeast with a network of Boolean functions (13). In this model, the cell-cycle dynamics is represented by trajectories of the Boolean states, which shift toward a fixed point corresponding to the biologically stable G1 phase. Although these deterministic models have clarified important aspects (14), effects of stochasticity still largely remain to be resolved.
Noise tolerance of a checkpoint mechanism in the cell cycle has been discussed theoretically (15) and the robustness of stochastic models of the cell cycles of budding yeast (16) and fission yeast (17) has been studied. In these models, however, noise was introduced as a given disturbance of the deterministic kinetic rules, and the mechanism by which the noise is generated was not discussed. In the study presented here, noise is described as a dynamical feature that is inevitable in the model, and the strength of the noise that should occur in the cell cycle is estimated to clarify the mechanism that ensures stability against thus generated noise.
Fluctuations in protein numbers in budding yeast have been measured by decomposing fluctuations into intrinsic and extrinsic noises (1,18,19). Intrinsic noise has been defined as fluctuations arising from smallness of molecule numbers in reactions. Extrinsic noise accounts for the rest of the noise, originating from fluctuating physiological conditions (20). In this article, we consider both intrinsic and extrinsic noises, regarding intrinsic noise as fluctuations arising from the stochastic dynamics of reactions in the regulation network of biomolecules, and extrinsic noise as fluctuations arising from mechanisms working outside the network. In prokaryotes, the combination of intrinsic and extrinsic noises in simulation has given a quantitative explanation of the experimentally observed protein levels (21). We use a similar approach, although the processes involved here are much more complex.
Our goal in this article is to clarify the mechanism of noise tolerance of the cyclic oscillation by using thus developed stochastic model of cell cycle.
STOCHASTIC MODEL OF THE CELL CYCLE
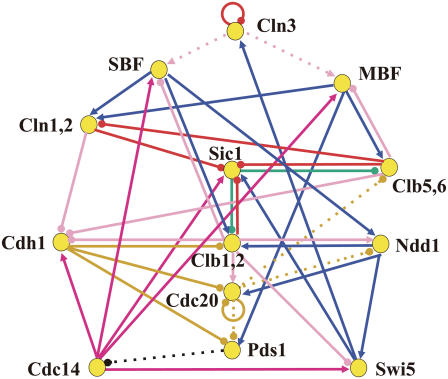
To address the questions of noise in the cell cycle, the budding yeast cell cycle is modeled (Fig. 1). In this model, each node represents a gene and its products, i.e., mRNA and protein. Transcription and translation are modeled at each node by the stochastic kinetic processes. Each link is the transcriptional regulation or the posttranscriptional regulation, such as phosphorylation, dephosphorylation, ubiquitination, or complex formation. The network includes 13 proteins discussed in Li et al. (13). Although the whole biomolecular network relevant to the cell cycle is gigantic, including more than 800 relevant genes (22), here only the essential part of it is abstracted. Marginal interactions between the network components in the model and those in other reactions in the cell are treated as constraints imposed on the model. See Supplementary Material for the catalog of molecular species and reactions in the model. There are still many important details in transcriptional and translational processes that are not explicitly considered in the model, such as chromatin remodeling or nucleosome replacement. The simplified coarse-grained modeling to neglect these aspects, however, was successful in quantitatively describing the dynamics of small regulatory networks in yeast cells (18,19), and we may expect that similar coarse-graining provides insights on the complex network presented here as well.
FIGURE 1.
Model of the reaction network that sustains the cell cycle of budding yeast. Each node represents a gene and its product, mRNA and protein. Arrows with a triangular head denote positive regulation, whereas arrows with a round head show negative regulation. Colors of arrows specify the types of regulation: transcriptional regulation (blue), phosphorylation (pink), dephosphorylation (dark pink), ubiquitination (yellow), phosphorylation as a mark of ubiquitination (red), protein-complex formation (green), and suppression of diffusion (black). Cdc28, which is CDK in budding yeast, is abundant through the cell cycle and hence is not explicitly considered in the model. Cln1 and Cln2 are assumed to work in combination and hence are treated as a unit (Cln1,2) in the model. Clb1,2 and Clb5,6 are also treated as units. The reactions indicated by dotted arrows are assumed to work only in specific stages: phosphorylation of SBF and MBF by Cln3 (stage 1), ubiquitination of Clb5,6, Ndd1, and Pds1 triggered by Cdc20 (stages 3–5), and suppression of diffusion of Cdc14 by Pds1 (stage 4).
Intrinsic noise is treated by describing the network state with three types of variables; states of genes, numbers of mRNA molecules, and numbers of protein molecules. We write ξ(μ) = 1 or “the μth gene is on” when the transcription factors are bound to the promoter of the μth gene, and ξ(μ) = 0 or “the μth gene is off”, otherwise. Transcription rates of 11 genes of Fig. 1, μ = PDS1, CLN1,2, CLN3, CLB1,2, CLB5,6, SIC1, CDC20, SWI5, and NDD1, are controlled by transcription factors in the network, so that each of them is transcribed with a high rate when ξ(μ) = 1 and with a low rate when ξ(μ) = 0. The other four genes are assumed to be transcribed constitutively, with a mild transcription rate: ξ(μ) is fixed to be ξ(μ) = 1 for μ = CDH1, CDC14, MBF, and SBF. See Table 1 of the Supplementary Material for the values of the transcription rate constant. The state of the μth gene, α(μ), is defined as α(μ) = ξ(μ) before the μth gene is duplicated, and α(μ) = (ξ(μ),ξ′(μ)) = (1,1), (1,0), (0,1), or (0,0) after the μth gene is duplicated.
A master equation is derived for the probability distribution of states of genes, numbers of mRNA molecules, and numbers of protein molecules residing in each of the chemical states. Equations for the moments of these states and numbers are derived and are treated approximately by truncating them at the second order of cumulants and by neglecting the cross-correlation between different molecular species. See Supplementary Material for the concrete form of the equations. The network dynamics is then numerically followed by solving a set of differential equations for means and variances: the mean number of mRNA molecules transcribed from the μth gene of state α at time t,  variance of the number of mRNA molecules,
  the mean number of μth protein molecules at chemical state X,
  variance of the number of protein molecules,
  and probability that the μth gene is at state α,
  Here, the suffix “int” indicates that averages are taken over the fluctuations caused by intrinsic noise. X denotes the chemical state of the protein: phosphorylated, dephosphorylated, or ubiquitinated. See Appendix for a precise definition of chemical states. Differential equations for means and variance are numerically solved to estimate the effects of intrinsic noise. Factors such as
  and
and  measure the strength of intrinsic noise.
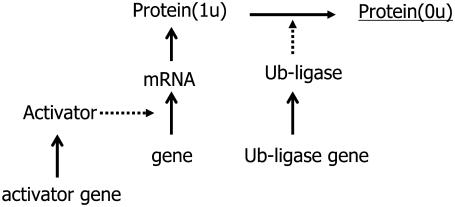
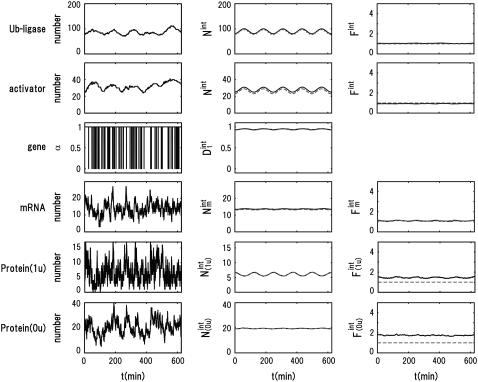
A benchmark test of the truncated cumulant approximation introduced above is carried out by taking the small reaction network shown in Fig. 2 as an example. The truncated cumulant approximation is applied to this system and the results are compared in Fig. 3 with the exact numerical simulation of the corresponding master equation. The truncated cumulant approximation agrees well with the numerical simulation for  and
and  but the approximation tends to underestimate
  Despite such systematic deviation, we can see in Fig. 3 that the approximation used here gives reasonable estimation for both
  and
and 
FIGURE 2.
Reaction system to test the truncated cumulant approximation. The synthesis rate of activator and that of ubiquitin ligase are modulated by sin(2πt/T) to mimic the cell-cycle oscillation with a typical period of T = 125 min. When activator is bound to the promoter of the gene, the gene is turned on to synthesize mRNA, which then yields Protein(1u). When Protein(1u) is ubiquitinated through the action of ubiquitin ligase, Protein(1u) is turned into Protein(0u). This unstable, short-lived protein is underlined. Although mRNA and all proteins are assumed to be degraded at certain specific rates in the model, those degradation processes are omitted from this figure. Coefficients of reaction rates are the same as in Table 1 in the Supplementary Material, except for the temporally modulated synthesis rates of activator and ubiquitin ligase.
FIGURE 3.
Comparison of the truncated cumulant approximation and the numerical Monte Carlo (MC) simulation. The MC simulation was performed by employing the Gillespie algorithm (31) to numerically solve the master equation that describes the reaction processes of Fig. 2. (Left column) An example of the trajectory of the numerical MC simulation. From top to bottom, the number of ubiquitin ligase, number of activator, number of mRNA, number of Protein(1u), and number of Protein(0u) are shown as a function of time. (Middle column) The mean number of corresponding molecules obtained by averaging 104 MC trajectories (solid lines) are compared with the mean number of molecules obtained by using the truncated cumulant approximation (dashed lines). (Right column) The Fano factor, i.e., the ratio of variance to mean of the number of molecules obtained by sampling 104 MC trajectories (solid lines) is compared with that obtained by using the truncated cumulant approximation (dashed lines). From top to bottom, the Fano factors of ubiquitin ligase, activator, mRNA, Protein(1u), and Protein(0u) are shown as a function of time.
As sources of extrinsic noise, we consider several types of events: regulations at checkpoints, release of Cdc14 at the late anaphase, DNA replication, and cell division. During the cell cycle, these events occur in a stochastic manner, which perturbs and diversifies the trajectories of { and
and  }. Strength of extrinsic noise is estimated from the diversity of the trajectories of
  and
and  as
as  and
and  where 〈…〉 indicates an average over an ensemble of trajectories. Then, the total cell-to-cell variances are
  and
and 
In the cell cycle, the checkpoint serves as a bridge between reactions in the network and physiological changes in the cell. For example, the spindle-assembly checkpoint blocks the onset of anaphase by suppressing the activity of Cdc20 in the network until properly attached chromosomes have lined up on the metaphase plate in the center of the spindle (23). Here, we consider checkpoints to monitor the following events or conditions: sufficient cell growth to start DNA replication (C1), completion of DNA replication (C2), and spindle assembly (C3). In addition to these checkpoints, the mitotic exit is tightly controlled by the release of Cdc14 from the nucleolus, and protein numbers are drastically changed by cell division. We refer to the release of Cdc14 as C4 and cell division as C5. We refer to the duration between Ci and Ci+1 (i = 1–4) as stage i and the duration between C5 and C1 as stage 5. See Fig. 4 for the definition of stages. Although there can be other cellular-level events or conditions whose details have not yet been clarified, we treat C1–C5 as representative samples to see how these events perturb the network dynamics. In this model, effects of the cellular-level events are expressed by modulations of reactions: Some reactions are allowed only before or after passing certain Ci, or, in other words, the network in Fig. 1 has some specific links that are validated only for certain stages. Duration of stage i in the rth round of the cell cycle, Tr(i), is determined as a random number fluctuating in the range  where T0(i) is the standard value of duration inferred from experiments; T0(1) = 40 min, T0(2) = 15 min, T0(3) = 20 min, T0(4) = 10 min, and T0(5) = 40 min (24–26). In this way, the structure of the differential equations is modulated when the system passes through {Ci} at the fluctuating timing. The fluctuation in timing works as extrinsic noise posed to the network.
FIGURE 4.
Definition of stages. Stages delimited by five cellular events, C1–C5, are compared with the cell-cycle phases using the usual terminology. In budding yeast, the boundary between S and G2 or that between G2 and M is vague.
DNA replication and cell division are other sources of extrinsic noise. In stage 1, DNA is replicated and each of 13 genes in the network is doubled. The time when each gene is duplicated is randomly selected at each round of the cell cycle between the time 10 min past C1 and the end of stage 1. After DNA is replicated, budding yeast cells undergo far less chromosomal condensation than animal cells and the nuclear envelope remains intact throughout the cell cycle, so that the transcription rate is kept high even in mitosis (27). After passing C5, the duplicated DNA and other molecules are distributed to daughter and mother cells. Although there is a temporal gap of several minutes between the nuclear separation and cytokinesis in real cells (25,26), for simplicity we do not distinguish their timing. In the simulation, the duplicated 13 genes are equally distributed to daughter and mother but the volume ratio between separated nuclei should bear fluctuations to some extent (25,26). We assume that the ratio is randomly fluctuating in the range from 1:1 to 0.9:1.1. Proteins that are localized in the nucleus are handed to the daughter according to this ratio. Cytokinesis should be fluctuating with greater amplitude than the nuclear separation, so we assume that mRNAs and proteins that may locate in cytoplasm are distributed to daughter and mother with a ratio fluctuating between 1:1 and 0.6:1.4.
In this way, both intrinsic and extrinsic noises are dynamically generated in the model. In the following, the statistical features of thus generated noises are compared with experiment to investigate how the cell cycle maintains a stable oscillation under the influence of these noises.
The network model of Fig. 1 includes >300 rate constants of reactions. Although we may be able to fit the individual experimental data by calibrating these parameters, such detailed comparison with experiments is not the purpose of this article. Our goal here is to quantify the statistical tendency of intrinsic and extrinsic noises to analyze the basic mechanism, which ensures the persistency of cyclic dynamics. To focus on such a mechanism, we adopt a simplified parameterization by categorizing reactions into 15 different types and assigning a single parameter to each type. These reactions and parameters are explained in Table 1 of the Supplementary Material.
RESULTS
Cell-cycle attractor
The five cellular events (C1–C5) were chosen as the initial starting points in the simulation. For each initial time point, 1000 initial values were randomly generated in the ranges  and
and  where Ng is the number of copies of genes in a cell; Ng = 1 for C1 and C5, and Ng = 2 for C2, C3, and C4. From all of the 5000 initial conditions tested, the simulated trajectories converged to a narrow region in the solution space and showed an oscillatory motion. In this narrow region, the numbers of mRNA molecules,
  were roughly in the range 0–30, and most of the numbers of protein molecules at chemical state
  were in the range 0–75, leading to the accumulated oscillation of
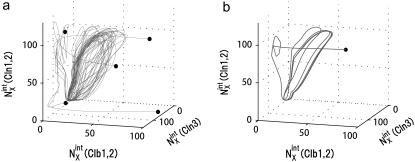
  in the range 0–130. We refer to this attractive region in the solution space as the cell-cycle attractor. Examples of five trajectories, starting at C1, are shown in Fig. 5 a by projecting them onto the space of three mean numbers of proteins. With this representation, the cell-cycle attractor appears as a doughnut-shaped region in the three-dimensional space.
FIGURE 5.
Convergence of trajectories to the cell-cycle attractor. Trajectories are projected onto the three-dimensional space of  with
with  with X = (1u), and
  with X = (0p)(1u). See Appendix for the definition of X. (a) Five trajectories starting at C1 with random initial conditions (solid circles) are attracted to the cell-cycle attractor. (b) Under the constraint that extrinsic noise is absent, trajectories converge to the cell-cycle attractor to form a limit cycle.
The convergent behavior of trajectories suggests that a stable closed orbit of the cyclic oscillation is hidden behind the cell-cycle attractor, which becomes clear when the external noise is turned off with the following constraints: 1), Durations of stages are fixed to standard values. 2), The 13 genes are duplicated at fixed timing in a fixed order. 3), In cell separation, both nucleus and cytoplasm are divided at a fixed ratio of 1:1 between mother and daughter cells. Under these constraints, trajectories converge to a closed orbit with  as shown in Fig. 5 b. We call this orbit the standard limit cycle. This standard limit cycle underlies the cell-cycle attractor toward which trajectories are attracted under the influence of extrinsic noise.
Robustness of the standard limit cycle was tested by changing parameters, one by one, from their standard values. The limit cycle remains stable when those parameters are between MIN and MAX shown in Table 1 in the Supplementary Material. For many parameters of posttranslational reactions, the ratio MAX/MIN exceeds 103. This robustness should partly justify our rough estimation of 15 grouped parameters instead of the precise determination of many individual parameters. For parameters relevant to the transcription and translation processes, this ratio is ∼2–3, indicating the importance of rather strict transcriptional regulations to maintain the cell cycle.
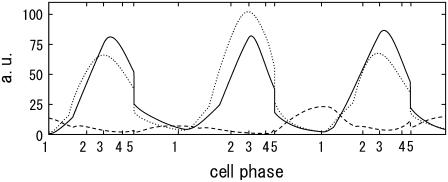
Stochastic trajectories attracted to the cell-cycle attractor are consistent with the observed cell-cycle oscillation. In Fig. 6, the mean numbers of three proteins, Clb2, Clb5, and Sic1, calculated under the influence of extrinsic noise, are shown. Here, the transcription rate of Clb5 in the model is adjusted to be smaller than transcription rates of other proteins by a factor of 0.5 to obtain the apparent agreement between the simulated peak height of the Clb5 number and the observed data (14). Other features, such as the small amount of Sic1 and the times that each protein number shows a peak, do not depend on this calibration. See Supplementary Material, Tables 2 and 3, to compare the simulated and observed data for other mRNAs and proteins.
FIGURE 6.
Temporal change of the mean numbers of Clb5,6, Clb1,2, and Sic1. Solid line,  dotted line,
  and dashed line,
  i = 1–5 on the horizontal axis indicates cellular events Ci.
Intrinsic and extrinsic noises
Strength of intrinsic and extrinsic noises can be quantified from the simulation results, which should then provide a basis from which to understand the stability of the cell-cycle attractor against these noises.
Strength of intrinsic noise was measured by  (μ, t) and
  calculated along the simulated trajectories.
  oscillates with an amplitude of
  for μ = CLN3, SIC1, CLN12, CLB56, PDS1, and CLB12, and with an amplitude of
  for μ = SWI5 and CDC20.
  for proteins involved in autocatalytic reactions, μ = Cln3 and Cdc20, oscillates with
  For the other 11 proteins,
  rapidly converges to unity and remains almost constant throughout the cell cycle. Although
  (μ, t) tends to be underestimated in this approximation, we should stress that for these 11 proteins,
  is kept smaller than for Cln3 and Cdc20. Such modest
  for many proteins implies that the design of the network that does not contain many autocatalytic loops or small-length positive feed-back loops effectively reduces intrinsic noise to prevent
  from being too large. In this way, the intrinsic noise in protein levels is suppressed, which stabilizes the cell-cycle attractor. Intrinsic noise in RNA levels is larger than that in protein levels, giving distributions wider than Poissonian. Such difference between
  and
and  is consistent with the frequently observed difference between transcriptome and proteome (28).
Strength of extrinsic noise,  can be estimated by sampling trajectories fluctuating around the standard limit cycle. Here,
  and 〈…〉 indicates an average over an ensemble of trajectories. Temporal change of
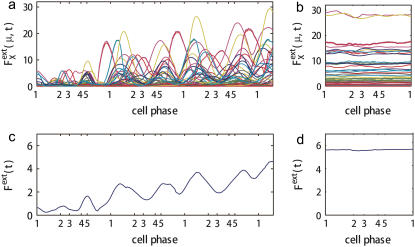
  is shown in Fig. 7 a for an ensemble of trajectories starting from C1 at t = 0. Although the individual
  depend on μ and X in characteristic ways, extrinsic noise accumulates as time proceeds, which randomly shifts the phase of each trajectory to increase
  In the large t limit, trajectories are completely dephased to make
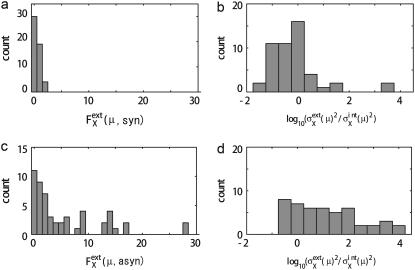
  constant as shown in Fig. 7 b. This effect is more evident when the average is taken over μ and X as shown in Fig. 7, c and d. Thus, extrinsic noise is small when cells are synchronous, with similar phases, and largest when cells are completely dephased. This difference between the ensemble of synchronous cells and that of asynchronous cells is shown in Fig. 8, a and c, by plotting histograms of
  for those ensembles. Also shown are histograms of
  averaged over ensembles of synchronous (Fig. 8 b) and asynchronous (Fig. 8 d) cells. Fig. 8 indicates that intrinsic noise is important when synchronous cells are sampled and extrinsic noise dominates when asynchronous cells are sampled.
FIGURE 7.
Dephasing and increase of extrinsic noise.  is averaged over 1200 trajectories starting at the same cell-cycle phase. Extrinsic noise accumulates over time due to the dephasing of trajectories (a and c). In the large t limit, trajectories are completely dephased to make
  almost constant (b and d). (c and d)
  are averaged over μ and X. i = 1–5 on the horizontal axis indicates the average time of passing Ci.
FIGURE 8.
Comparison of noise between synchronous cells and asynchronous cells. (a and b) Distribution of  and
and  respectively, of synchronous cells calculated by sampling 5000 trajectories at the same cell-cycle phases. Distributions over 125 time points are shown. (c and d) Distributions of asynchronous cells calculated by sampling 5000 trajectories at random phases. Distributions over 100 sets of 5000 trajectories are shown. (b and d) Tails of
  are not shown. Distributions at
  arise from proteins that have very small numbers for most of the cell-cycle duration.
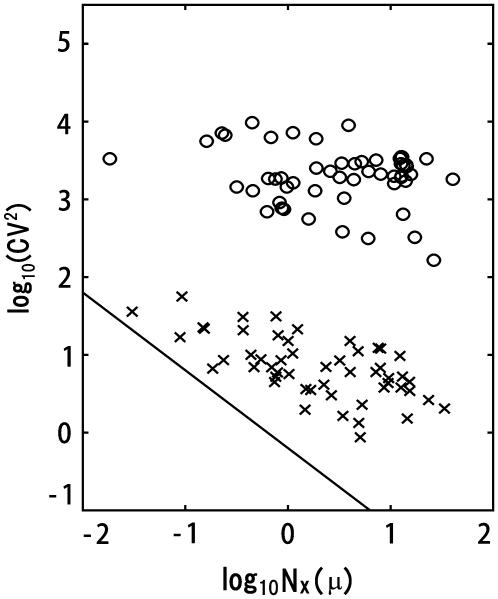
Such dominance of intrinsic or extrinsic noise can be verified by comparing the calculated results with the experimental data. In a study by Newman et al. (1) a proteome-wide measurement of fluctuations of protein levels was reported by sorting cells according to size. The sorting was performed by gating cell flow to select cells smaller than the gate size. Since the cell size is smallest just after cell division and increases through the cell cycle, gated cells should correspond to cells just after C5 in the simulation. Averages over ungated cells should be the averages over asynchronous cells. In Fig. 9, the simulated results of  are plotted as functions of NX(μ) for both gated and ungated cases, where
  The extrinsic noise is reduced by gating and the feature of constant
  is manifested in the plot to make CV(μ, X)2 roughly proportional to 1/NX(μ). The same feature of CV2 ≈ 1/N was observed in the gated data of Newman et al. (1). We should note, however, that
  does not completely vanish even when the cell phase is specified, as in gated cells, which is consistent with the observations in Newman et al. (1) and Raser and O'Shea (19). In Fig. 9, CV(μ, X)2 for ungated cells is dominated by the extrinsic noise and takes values around 103.5, with weaker dependence on NX(μ), as was observed by Newman et al. (1). Thus, the model described here quantitatively reproduces observed features of intrinsic and extrinsic noises.
FIGURE 9.
Dominance of intrinsic or extrinsic noise. CV(μ, X)2 of the number of proteins of ungated cells (circles) and that of gated cells (crosses) are plotted as functions of NX(μ). Intrinsic noise is dominant in gated cells to make CV(μ, X)2 roughly proportional to 1/NX(μ). Solid line has a slope of −1. The number of sampled trajectories is 100 for gated cells and 3000 for ungated cells.
Consecutive appearance of fixed points
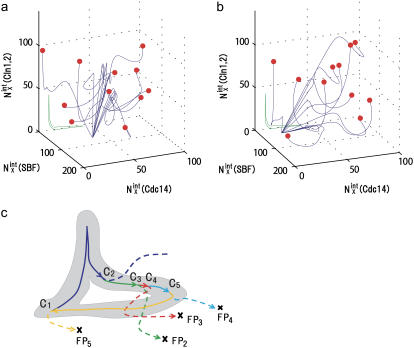
Though both intrinsic and extrinsic noises are large, the cell cycle remains stable owing to the large basin of attraction of the cell-cycle attractor. The mechanism of attraction of trajectories to the cell-cycle attractor can be analyzed by calculating the long-time asymptotic behavior of trajectories. This behavior is examined by prolonging each stage one by one: We assume a situation where the checkpoint is very stringent or the release of Cdc14 or the cell division is prohibited, preventing the system from passing over Ci+1. Then, the cell cycle is arrested at stage i. For i = 2–5, trajectories thus arrested at stage i converged to a fixed point characteristic to each stage. This fixed point corresponds to a set of constants, { and
and  }, and we call this set FPi. In Fig. 10, sample trajectories converged to FP3 and FP5 are shown. Trajectories converge to FPi as
  quickly approaches 0 when μ is a protein rapidly degraded through ubiquitination, whereas
  for other proteins decreases rather slowly, taking longer than T0(i).
FIGURE 10.
Convergence of trajectories to a fixed point. (a) Eleven trajectories starting from C3 with random initial conditions (red circles) converge to FP3 when stage 3 is prolonged. (b) Eleven trajectories starting from C5 with random initial conditions (red circles) converge to FP5 when stage 5 is prolonged. Blue lines are trajectories projected onto the three-dimensional space of  with X = (0p)(1p),
  with X = (outside), and
  with X = (1p)(1u). See Appendix for the definition of X. The green line represents the standard limit cycle. (c) An illustrative explanation of how the consecutively appearing fixed points drive the cell-cycle oscillation. The standard limit cycle is shown in the same three-dimensional space as in a and b. Each stage in the limit cycle is specified by different colors: stage 1 (dark blue), stage 2 (green), stage 3 (red), stage 4 (light blue), and stage 5 (orange). When stage i is prolonged for i = 2–5, the trajectory approaches the fixed point, FPi, as shown by dashed lines. When stage 1 is prolonged, trajectories tend to converge along the dark blue dashed line, but the corresponding fixed point was not numerically found in the model. Extrinsic noise induces fluctuations of trajectories in the cell-cycle attractor, which is designated by the hatched region.
The large basin of attraction of FPi is the origin of the large basin of attraction of the cell-cycle attractor. Trajectories starting from distributed initial states tend to converge toward FPi. In the usual physiological condition, however, the next cellular event of Ci+1 takes place before trajectories reach FPi and brings the system into stage i + 1 to direct trajectories to FPi+1. In this way, the cell-cycle oscillation is maintained by the consecutive disappearance and appearance of {FPi}. It should be noted that FPi is separate from the standard limit cycle, as shown in Fig. 10. This deviation of fixed points allows smooth oscillations in protein and mRNA levels without being trapped at each FPi. Despite such deviation of fixed points from the standard oscillatory trajectories, a shift of the fixed point from FPi to FPi+1 is the driving force to move the system from stage i to stage i + 1. This mechanism of cell-cycle dynamics is illustrated in Fig. 10 c. As shown in Figs. 5 and 10, width of the basin of attraction of the thus generated cell-cycle attractor is δNX(μ) > 102, whereas, as shown in Fig. 9, the width  of the region in which trajectories stochastically wander during the cell cycle is
  100–102. Such a large basin of attraction, with
  ensures stable oscillation in the cell cycle.
SUMMARY AND DISCUSSIONS
In this article, a stochastic model of the cell cycle of budding yeast was constructed, and statistical features of noise in the cell-cycle oscillation were analyzed. The model predicted that the amplitude of protein-level fluctuation is as large as  when an ensemble of synchronous cells are sampled. Despite such intense stochasticity, the simulated cell cycle shows stable oscillation and attracts trajectories from widely scattered initial conditions. This stability of cell cycle is assured by consecutively appearing fixed points, each of which has a large basin of attraction. Using a deterministic model of the cell cycle, Tyson and colleagues (7,8) showed that the oscillation is maintained by cyclic transitions between two fixed points. In their model, transition is strongly affected by a continuous growth of the cell volume that regulates rates in the reaction network. In the model presented here, the reaction network is controlled by many other molecular mechanisms, including checkpoints, DNA replication, and cytokinesis, which then yield a larger number of consecutively appearing fixed points. In this sense, the model described here is an extension of the model of Tyson et al. toward treating the richer biochemical mechanisms to regulate the core reaction network.
The fixed-point states in the model deviate from the usual physiological states of oscillation, but appear when the lifting of checkpoints is postponed. The model shows that the hallmark of fixed-point appearance is a diminution of the extrinsic noise. Comparison of statistical features of noises at a fixed point in the model with those in the cells arrested in the corresponding stage in experiments should be important to confirm the mechanism proposed in this article.
An interesting question is how the perturbed cells are attracted to the cell-cycle attractor. It is left for further study to compare the simulated pathways of attraction of cells with experiments. It would be interesting also to examine whether the consecutive appearance of fixed points is the effective design principle in other reaction networks in cells as well (29,30). Quantitative comparison of features of noisy dynamics should provide a key to examine whether such a design principle works in those reaction networks.
SUPPLEMENTARY MATERIAL
To view all of the supplemental files associated with this article, visit www.biophysj.org.
Supplementary Material
Acknowledgments
Y.O. thanks the Research Fellowships for Young Scientists from the Japan Society for the Promotion of Science.
This work was supported by grants from the Ministry of Education, Culture, Sports, Science, and Technology, Japan, and by grants for the 21st century Centers of Excellence program for Frontiers of Computational Science.
APPENDIX: CHEMICAL STATES OF PROTEINS
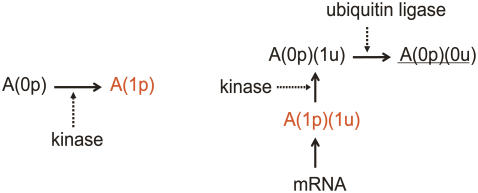
The activity and stability of individual proteins are dependent on their chemical states. For example, some proteins need to be phosphorylated to show the catalytic activity, and proteins are rapidly degraded if ubiquitinated. When a protein can be phosphorylated by a kinase, we write the chemical state of the protein as X = (αp), where α = 1 or 0, and p indicates that the chemical modification takes place on the phosphorylation site. If the phosphorylated form of the protein is active and the dephosphorylated form is inactive, we write the former as X = (1p) and the latter as X = (0p), and if the phosphorylated form is inactive and the dephosphorylated form is active, the former is X = (0p) and the latter X = (1p). When a protein is targeted not only by a kinase but also by a ubiquitin ligase, then the phosphorylation site is denoted by p and the ubiquitination site by u. The chemical state is represented by X = (αp)(α′u). We write α′ = 1 when the protein is not ubiquitinated, and α′ = 0 when it is ubiquitinated. Fig. 11 describes examples of reaction schemes. Chemical states of Cdc14 are distinguished by its location, namely whether Cdc14 is confined in the nucleolus (X = inside) or diffuses over the cytoplasm (X = outside). See Table 1 for a catalog of the chemical states considered in this model.
FIGURE 11.
Examples of reaction schemes. (Left) Phosphorylation. (Right) Translation, phosphorylation, and ubiquitination. Protein A in chemical state X is denoted by AX. Catalytic actions are denoted by dotted arrows. Active proteins are denoted in red. The unstable, short-lived protein is underlined. Although mRNA and all forms of protein are assumed to be degraded at certain specific rates in the model, those degradation processes are omitted from this figure.
TABLE 1.
Activity and stability of proteins in the model
| Protein | State | Activity | Stability | Location |
|---|---|---|---|---|
| Cln3 | (1p)(1u) | (+) | + | Nuclear |
| (0p)(1u) | (+) | + | Nuclear | |
| (0p)(0u) | (+) | − | Nuclear | |
| SBF | (1p)(1p) | + | + | Nuclear |
| (0p)(1p) | − | + | Nuclear | |
| (0p)(0p) | − | + | Cytoplasm | |
| MBF | (1p)(1p) | + | + | Nuclear |
| (0p)(1p) | − | + | Nuclear | |
| (0p)(0p) | − | + | Cytoplasm | |
| Cln1,2 | (1p)(1u) | + | + | Nuclear |
| (0p)(1u) | + | + | Cytoplasm | |
| (0p)(0u) | + | − | Cytoplasm | |
| Sic1 | (1p)(1u) | + | + | Whole |
| (0p)(1u) | + | + | Whole | |
| (0p)(0u) | + | − | Whole | |
| Clb5,6 | (1u) | + | + | Nuclear |
| (0u) | + | − | Nuclear | |
| Sic1/Clb5,6 | (1p)(1u)(1u) | − | Nuclear | |
| (0p)(1u)(1u) | − | Nuclear | ||
| (0p)(0u)(1u) | − | Nuclear | ||
| (1p)(1u)(0u) | − | Nuclear | ||
| (0p)(1u)(0u) | − | Nuclear | ||
| (0p)(0u)(0u) | − | Nuclear | ||
| Ndd1 | (1p)(1u) | + | + | Nuclear |
| (0p)(1u) | − | + | Nuclear | |
| (1p)(0u) | + | − | Nuclear | |
| (0p)(0u) | − | − | Nuclear | |
| Clb1,2 | (1u) | + | + | Nuclear |
| (0u) | + | − | Nuclear | |
| Sic1/Clb1,2 | (1p)(1u)(1u) | − | Nuclear | |
| (0p)(1u)(1u) | − | Nuclear | ||
| (0p)(0u)(1u) | − | Nuclear | ||
| (1p)(1u)(0u) | − | Nuclear | ||
| (0p)(1u)(0u) | − | Nuclear | ||
| (0p)(0u)(0u) | − | Nuclear | ||
| Cdc20 | (1p)(1u) | (+) | + | Nuclear |
| (0p)(1u) | (+) | + | Nuclear | |
| (1p)(0u) | (+) | − | Nuclear | |
| (0p)(0u) | − | − | Nuclear | |
| Pds1 | (1u) | + | + | Nuclear |
| (0u) | + | − | Nuclear | |
| Cdc14 | Outside | + | Outside of nucleolus | |
| Inside | − | Inside of nucleolus | ||
| Cdh1 | (1p)(1p)(1p) | + | + | Nuclear |
| (1p)(1p)(0p) | − | + | Cytoplasm | |
| (1p)(0p)(1p) | − | + | Cytoplasm | |
| (1p)(0p)(0p) | − | + | Cytoplasm | |
| (0p)(1p)(1p) | − | + | Cytoplasm | |
| (0p)(1p)(0p) | − | + | Cytoplasm | |
| (0p)(0p)(1p) | − | + | Cytoplasm | |
| (0p)(0p)(0p) | − | + | Cytoplasm | |
| Swi5 | (1p) | + | − | Nuclear |
| (0p) | − | + | Cytoplasm | |
Activity: + active, − inactive, (+) active only in specific stages.
Stability: + stable, − highly unstable.
Apart from Cdc14, “Location” is used in the model only to determine the distribution ratio in the cell separation.
Editor: Dagmar Ringe.
References
- 1.Newman, J. R. S., S. Ghaemmaghami, J. Ihmels, D. K. Breslow, M. Noble, J. L. DeRisi, and J. S. Weissman. 2006. Single-cell proteomic analysis of S. cerevisiae reveals the architecture of biological noise. Nature. 441:840–846. [DOI] [PubMed] [Google Scholar]
- 2.Raser, J. M., and E. K. O'Shea. 2005. Noise in gene expression: origins, consequences, and control. Science. 309:2010–2013. [DOI] [PMC free article] [PubMed] [Google Scholar]
- 3.Sigal, A., R. Milo, A. Cohen, N. Geva-Zatorsky, Y. Klein, Y. Liron, N. Rosenfeld, T. Danon, N. Perzov, and U. Alon. 2006. Variability and memory of protein levels in human cells. Nature. 444:643–646. [DOI] [PubMed] [Google Scholar]
- 4.Field, C., R. Li, and K. Oegema. 1999. Cytokinesis in eukaryotes: a mechanistic comparison. Curr. Opin. Cell Biol. 11:68–80. [DOI] [PubMed] [Google Scholar]
- 5.Mendenhall, M. D., and A. E. Hodge. 1998. Regulation of Cdc28 cyclin-dependent protein kinase activity during the cell cycle of the yeast Saccharomyces cerevisiae. Microbiol. Mol. Biol. Rev. 62:1191–1243. [DOI] [PMC free article] [PubMed] [Google Scholar]
- 6.Novak, B., A. Csikasz-Nagy, B. Gyorffy, K. Nasmyth, and J. J. Tyson. 1998. Model scenarios for evolution of the eukaryotic cell cycle. Philos. Trans. R. Soc. Lond. B Biol. Sci. 353:2063–2076. [DOI] [PMC free article] [PubMed] [Google Scholar]
- 7.Chen, K. C., L. Calzone, A. Csikasz-Nagy, F. R. Cross, B. Novak, and J. J. Tyson. 2004. Integrative analysis of cell cycle control in budding yeast. Mol. Biol. Cell. 15:3841–3862. [DOI] [PMC free article] [PubMed] [Google Scholar]
- 8.Chen, K. C., A. Csikasz-Nagy, B. Gyorffy, J. Val, B. Novak, and J. J. Tyson. 2000. Kinetic analysis of a molecular model of the budding yeast cell cycle. Mol. Biol. Cell. 11:369–391. [DOI] [PMC free article] [PubMed] [Google Scholar]
- 9.Novak, B., and J. J. Tyson. 2003. Modelling the controls of the eukaryotic cell cycle. Biochem. Soc. Trans. 31:1526–1529. [DOI] [PubMed] [Google Scholar]
- 10.Tyson, J. J., K. Chen, and B. Novak. 2001. Network dynamics and cell physiology. Nat. Rev. Mol. Cell Biol. 2:908–916. [DOI] [PubMed] [Google Scholar]
- 11.Borisuk, M. T., and J. J. Tyson. 1998. Bifurcation analysis of a model of mitotic control in frog eggs. J. Theor. Biol. 195:69–85. [DOI] [PubMed] [Google Scholar]
- 12.Nasmyth, K. 1996. At the heart of the budding yeast cell cycle. Trends Genet. 12:405–412. [DOI] [PubMed] [Google Scholar]
- 13.Li, F., T. Long, Y. Lu, Q. Ouyang, and C. Tang. 2004. The yeast cell-cycle network is robustly designed. Proc. Natl. Acad. Sci. USA. 101:4781–4786. [DOI] [PMC free article] [PubMed] [Google Scholar]
- 14.Cross, F. R., V. Archambault, M. Miller, and M. Klovstad. 2002. Testing a mathematical model of the yeast cell cycle. Mol. Biol. Cell. 13:52–70. [DOI] [PMC free article] [PubMed] [Google Scholar]
- 15.Doncic, A., E. Ben-Jacob, and N. Barkai. 2006. Noise resistance in the spindle assembly checkpoint. Mol. Syst. Biol. 2:2006.0027. [DOI] [PMC free article] [PubMed] [Google Scholar]
- 16.Zhang, Y., M. Qian, Q. Ouyang, M. Deng, F. Li, and C. Tang. 2006. Stochastic model of yeast cell-cycle network. Physica D. 219:35–39. [Google Scholar]
- 17.Wang, J., B. Huang, X. Xia, and Z. Sun. 2006. Funneled landscape leads to robustness of cell networks: yeast cell cycle. PLoS Comput. Biol. 2:1385–1394. [DOI] [PMC free article] [PubMed] [Google Scholar]
- 18.Blake, W. J., M. Kærn, C. R. Cantor, and J. J. Collins. 2003. Noise in eukaryotic gene expression. Nature. 422:633–637. [DOI] [PubMed] [Google Scholar]
- 19.Raser, J. M., and E. K. O'Shea. 2004. Control of stochasticity in eukaryotic gene expression. Science. 304:1811–1814. [DOI] [PMC free article] [PubMed] [Google Scholar]
- 20.Elowitz, M. B., A. J. Levine, E. D. Siggia, and P. S. Swain. 2002. Stochastic gene expression in a single cell. Science. 297:1183–1186. [DOI] [PubMed] [Google Scholar]
- 21.Guido, N. J., X. Wang, D. Adalsteinsson, D. McMillen, J. Hasty, C. R. Cantor, T. C. Elston, and J. J. Collins. 2006. A bottom-up approach to gene regulation. Nature. 439:856–860. [DOI] [PubMed] [Google Scholar]
- 22.Spellman, P. T., G. Sherlock, M. Q. Zhang, V. R. Iyer, K. Anders, M. B. Eisen, P. O. Brown, D. Botstein, and B. Futcher. 1998. Comprehensive identification of cell cycle-regulated genes of the yeast Saccharomyces cerevisiae by microarray hybridization. Mol. Biol. Cell. 9:3273–3297. [DOI] [PMC free article] [PubMed] [Google Scholar]
- 23.Melo, J., and D. Toczyski. 2002. A unified view of the DNA-damage checkpoint. Curr. Opin. Cell Biol. 14:237–245. [DOI] [PubMed] [Google Scholar]
- 24.Bi, E., P. Maddox, D. J. Lew, E. D. Salmon, J. N. McMillan, E. Yeh, and J. R. Pringle. 1998. Involvement of an actomyosin contractile ring in Saccharomyces cerevisiae cytokinesis. J. Cell Biol. 142:1301–1312. [DOI] [PMC free article] [PubMed] [Google Scholar]
- 25.Shaw, S. L., P. Maddox, R. V. Skibbens, E. Yeh, E. D. Salmon, and K. Bloom. 1998. Nuclear and spindle dynamics in budding yeast. Mol. Biol. Cell. 9:1627–1631. [DOI] [PMC free article] [PubMed] [Google Scholar]
- 26.Yeh, E., R. V. Skibbens, J. W. Cheng, E. D. Salmon, and K. Bloom. 1995. Spindle dynamics and cell cycle regulation of dynein in the budding yeast, Saccharomyces cerevisiae. J. Cell Biol. 130:687–700. [DOI] [PMC free article] [PubMed] [Google Scholar]
- 27.Strunnikov, A. V. 2003. Condensin and biological role of chromosome condensation. Prog. Cell Cycle Res. 5:361–367. [PubMed] [Google Scholar]
- 28.Griffin, T. J., S. P. Gygi, T. Ideker, B. Rist, J. Eng, L. Hood, and R. Aebersold. 2002. Complementary profiling of gene expression at the transcriptome and proteome levels in Saccharomyces cerevisiae. Mol. Cell. Proteomics. 1:323–333. [DOI] [PubMed] [Google Scholar]
- 29.Sasai, M., and P. G. Wolynes. 2003. Stochastic gene expression as a many-body problem. Proc. Natl. Acad. Sci. USA. 100:2374–2379. [DOI] [PMC free article] [PubMed] [Google Scholar]
- 30.Wang, J., B. Huang, X. Xia, and Z. Sun. 2006. Funneled landscape leads to robustness of cellular networks: MAPK signal transduction. Biophys. J. 91:L54–L56. [DOI] [PMC free article] [PubMed] [Google Scholar] [Retracted]
- 31.Gillespie, D. T. 1977. Exact stochastic simulation of coupled chemical reactions. J. Phys. Chem. 81:2340–2361. [Google Scholar]
Associated Data
This section collects any data citations, data availability statements, or supplementary materials included in this article.


