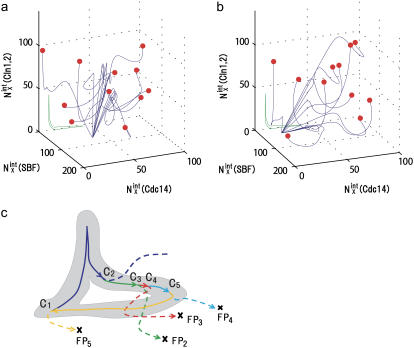
FIGURE 10.
Convergence of trajectories to a fixed point. (a) Eleven trajectories starting from C3 with random initial conditions (red circles) converge to FP3 when stage 3 is prolonged. (b) Eleven trajectories starting from C5 with random initial conditions (red circles) converge to FP5 when stage 5 is prolonged. Blue lines are trajectories projected onto the three-dimensional space of  with X = (0p)(1p),
  with X = (outside), and
  with X = (1p)(1u). See Appendix for the definition of X. The green line represents the standard limit cycle. (c) An illustrative explanation of how the consecutively appearing fixed points drive the cell-cycle oscillation. The standard limit cycle is shown in the same three-dimensional space as in a and b. Each stage in the limit cycle is specified by different colors: stage 1 (dark blue), stage 2 (green), stage 3 (red), stage 4 (light blue), and stage 5 (orange). When stage i is prolonged for i = 2–5, the trajectory approaches the fixed point, FPi, as shown by dashed lines. When stage 1 is prolonged, trajectories tend to converge along the dark blue dashed line, but the corresponding fixed point was not numerically found in the model. Extrinsic noise induces fluctuations of trajectories in the cell-cycle attractor, which is designated by the hatched region.

