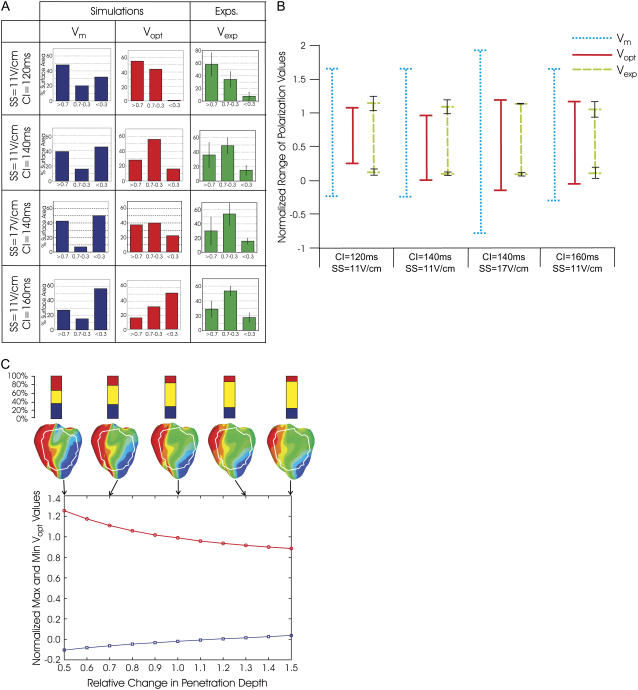
FIGURE 4.
(A) Percentage of surface area, within experimental field of view, of polarization values >0.7, 0.3–0.7, and <0.3, for Vm, Vopt, and Vexp maps and for different combinations of SS/CI. For Vexp, mean values are shown with error bars of one standard deviation. For each SS/CI, the number of rabbits in experiments varied as follows: n = 4 (11 V/cm/120 ms); n = 5 (11 V/cm/140 ms); and n = 2 (17 V/cm/140 ms); and n = 5 (11 V/cm/160 ms). (B) Range of normalized polarization values in Vm, Vopt, and Vexp within experimental field of view for episodes shown in Fig. 3 A. (C) Variation in maximum/minimum normalized Vopt polarization shown in B for the CI = 140 ms/SS = 11 V/cm episode as penetration depths at illumination and emission wavelengths change simultaneously by relative fractions between 0.5 and 1.5. Corresponding Vopt polarization distributions are shown for selected penetration depths, along with representations of percentage of area within the experimental field of view having normalized VEP of >0.7, 0.3–0.7, and <0.3.

