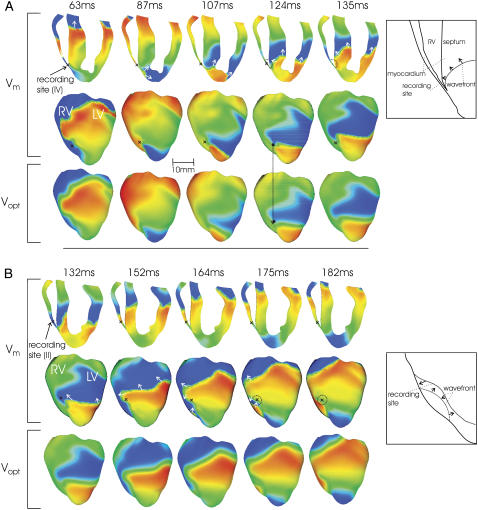
FIGURE 8.
Simulated Vm (anterior epicardial and in a cross section) and Vopt maps during sustained VT; notations are as in Fig. 5. Schematic drawings (right) present formation of dual-hump APs due to A, delayed propagation into septum (Fig. 5, trace iv); and B, surface wavefront collision (Fig. 6, trace ii).

