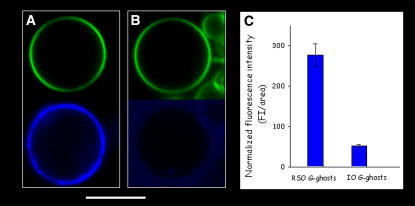
FIGURE 3.
Fluorescence intensity representative images of RSO (A) and IO (B) G-ghosts in the presence of blood group A specific marker (blue); the G-ghosts are labeled with DiIC18 lipophilic fluorescent probe (green). (C) Normalized average fluorescence intensity observed in RSO and IO G-ghost preparations (obtained over 30 individual vesicles) on addition of the immunofluorescence marker against blood group A (right panel). All the images were obtained at 20°C in 25 mM HEPES, 150 mM NaCl, pH 7.2. The white bar corresponds to 20 μm.

