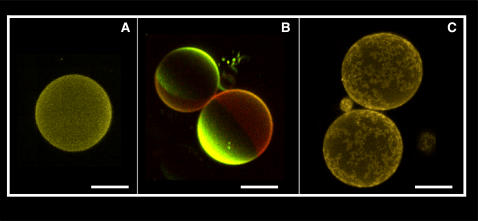
FIGURE 6.
Fluorescence images (false color representation) of DiIC18-labeled GUVs composed of red blood cell membrane lipid extracts (A). Laurdan-labeled GUVs composed of (DOPC:DPPC)/cholesterol ((1:1)/20 mol %); red and green areas correspond to liquid-ordered and liquid-disordered phases, respectively (B). DiIC18-labeled GUVs composed of POPC/DPPC 3:2 mol (C); the high-fluorescence-intensity areas correspond to DPPC-rich gel phase. All the images were obtained at 20°C in 25 mM HEPES, 150 mM NaCl, pH 7.2. The white bar corresponds to 10 μm.

