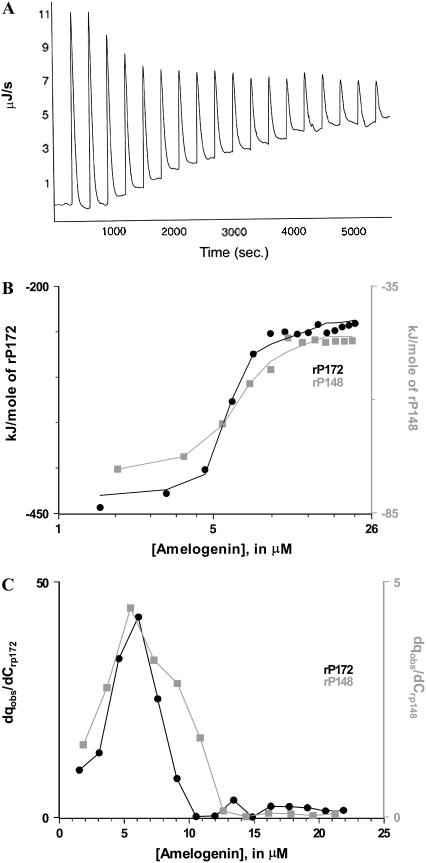
FIGURE 6.
ITC dilution studies on rP172 and rP148. (A) ITC raw data for the dilution of rP172 in Tris-HCl buffer (pH = 5.8) at 25°C. (B) The integrated normalized heat per mole of the injectant is plotted against the total protein concentration in the cell. (C) The progress of the transition is obtained as the first derivative of the plot in B. The maximum in the curve is taken as the critical aggregation concentration.

