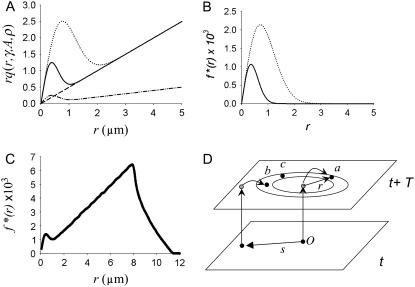
FIGURE 4.
Distribution of neighbor distances from the central spark. (A) Plot of rq(r,γ, A, ρ). (Dashed line, γ = 5 × 10⁻⁴, A = 0, ρ = 0.5; solid curve, same as before except A = 10; dotted curve, same except ρ = 1.0. Dot-dash curve, γ = 1 × 10⁻⁴, A = 10, ρ = 0.5.) (B) Difference curve, rq(r,γ, A, ρ)− rq(r,γ, 0, ρ). Line style corresponds to panel A. (C) Normalized distance distribution f*(r) for simulated data. (D) Schematic of a more complete model showing how a noncentral spark at  contributes to sparks (labeled b) in the annulus. Colors of circles (solid and shaded) have the same meaning as in Fig. 3 D. Spark c occurred spontaneously and spark a was triggered by the central spark at the origin O.

