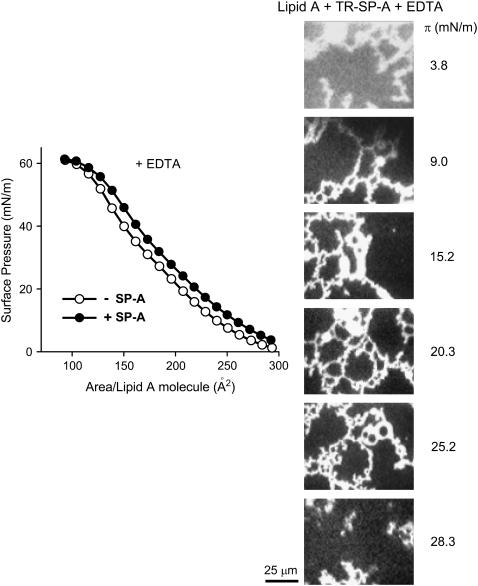
FIGURE 9.
(Left panel) Isotherms of monolayers of lipid A spread onto a buffered saline subphase containing 150 μM EDTA in the absence (○) and presence (•) of 0.08 μg/ml SP-A at 25°C. (Right panel) Typical epifluorescence microscopic images recorded through a filter that selects fluorescence coming from TR-SP-A at different surface pressures. The scale bar is 25 μm.

