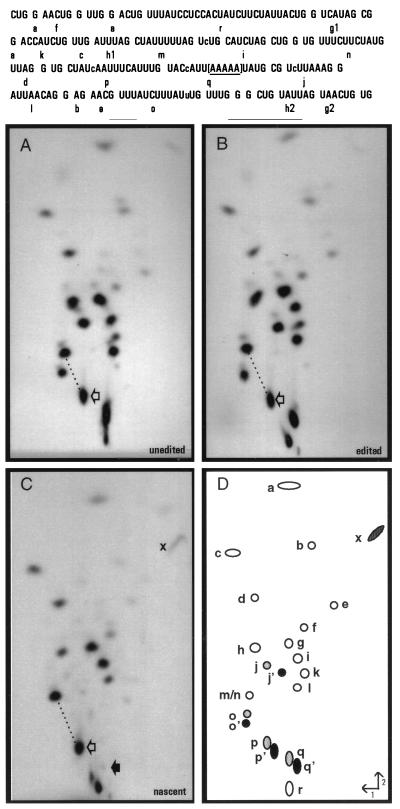
Figure 3.
RNase T1 fingerprint analyses. (Upper) Sequence of the region of interest with individual T1 oligonucleotides shown. Note that as [α-32P]ATP was used to label each RNA, only the indicated RNase T1 oligonucleotides derived from this region of the coI mRNA are visible. The bracketed area represents the region in which the transcription complexes stall under limiting ATP conditions in isolated mitochondria. Lowercase letters within the sequence indicate sites of nucleotide insertion. (Lower) [α-32P]ATP-labeled RNAs were gel purified after S1 protection with coI-specific probes (A–C, probes 3 a–c, respectively), digested with ribonuclease T1 and the resulting oligonucleotides separated in two dimensions. Fingerprints derived from (A) unedited coI control transcript, (B) edited coI control transcript, (C) nascent RNA synthesized in isolated mitochondria. RNase T1 oligonucleotides shown schematically in D were identified by secondary analysis and differential labeling of specific RNase T1 oligonucleotides in control fingerprints. (○), oligonucleotides not affected by editing; ( ), position of oligonucleotides without inserted nucleotides; (•), oligonucleotides with inserted nucleotides. For oligonucleotides overlapping sites of nucleotide insertion, each apostrophe designates the presence of an added nucleotide. Open arrows indicate oligonucleotides p and p′; the solid arrow in C indicates the position where oligonucleotide q/q′ would be located if present. When oligonucleotide p′ is processed by C insertion, its mobility is reduced in both dimensions, resulting in a shift in the fingerprint pattern downward and to the right with respect to oligonucleotides m/n. The difference in mobility of oligonucleotide p/p′ in unedited and edited RNAs relative to oligonucleotides m/n is highlighted by the dotted line. x indicates the terminal fragment in nascent RNA that is derived from the 5′ end of oligonucleotide q. Labeled mitochondrial RNAs were synthesized in the presence of 150 μM CTP, GTP, and UTP and 200 nM [α-32P]ATP.

