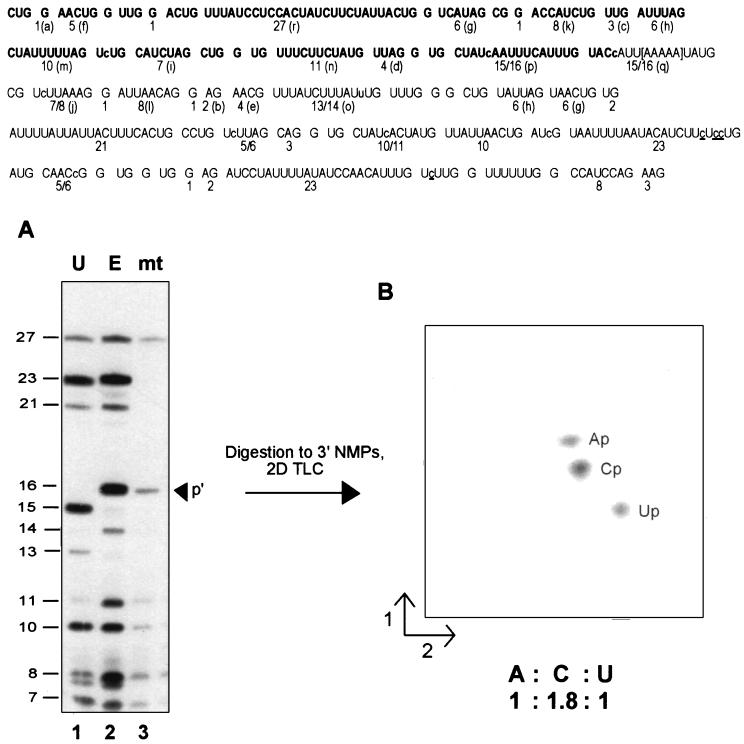
Figure 4.
Denaturing gel separation and secondary analyses. (Upper) Sequence of the RNase T1 oligonucleotides present in the S1 nuclease-protected region. The size of each [α-32P]ATP-labeled fragment is indicated; for ease of comparison, the letter assignments from Fig. 3 are shown in parentheses. The region in which the transcription complexes stall under limiting ATP conditions in isolated mitochondria is shown in brackets. Note that while the control transcripts on this gel extend 152 nt beyond those shown in the previous figure, the nascent mitochondrial RNA has the same 3′ end as that shown in Fig. 3. RNase T1 oligonucleotides visible in the mitochondrial RNA fingerprint (Fig. 3C) are indicated in boldface. Nucleotide insertion sites are shown in lowercase letters within the sequence; sites of C to U changes are underlined. (Lower) (A) [α-32P]ATP-labeled RNAs were gel purified after S1 nuclease protection with coI-specific probes (probes 4 a–c, respectively), digested with ribonuclease T1, and the resulting oligonucleotides separated on a denaturing 20% polyacrylamide gel. Oligonucleotide sizes are indicated at left. Lanes: 1, unedited coI control transcript; 2, edited coI control transcript; 3, nascent RNA synthesized in isolated mitochondria in the presence of 150 μM CTP, GTP, and UTP and 200 nM [α-32P]ATP. The arrowhead indicates the position of RNase T1 oligonucleotide p′ in the mitochondrial RNA sample. (B) RNase T1 oligonucleotide p′ from the sample in lane 3 was eluted from the gel, digested to mononucleotides, and the resulting 3′ NMPs separated via two-dimensional thin-layer chromatography as described.

