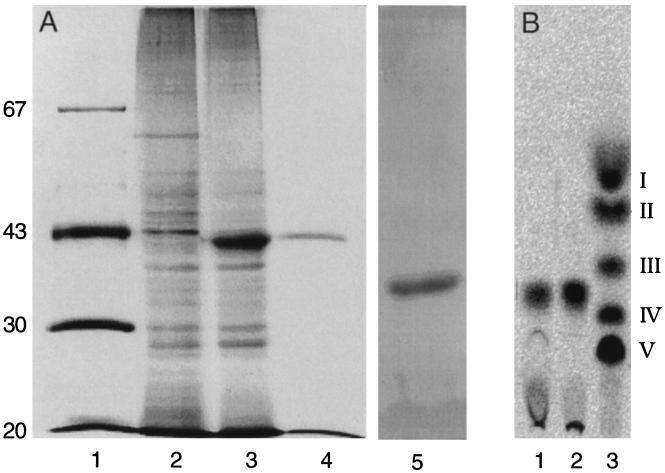
Figure 2.
Purification of active NodZ protein. (A) Samples from the purification steps were analyzed by PAGE using silver staining for detection of protein. Lane 1, marker proteins with the molecular masses indicated in kDa; lane 2, crude protein extract of E. coli strain BL21(DE3) harboring pET9A; lane 3, crude protein extract of E. coli strain BL21(DE3) harboring pMP2452; lane 4, protein fraction obtained after the last purification step (the quantity applied is equivalent to the yield from the sample in lane 3); and lane 5, test of purity of 1 μg of purified NodZ protein. (B) TLC analysis of reaction products resulting from in vitro activity of purified NodZ protein. Lane 1, reaction product of chitin trisaccharide incubated with the pure protein preparation analyzed in A, lane 4; lane 2, reaction product of chitin trisaccharide incubated with the crude protein preparation of A, lane 3; lane 3, standard of radiolabeled chitin oligosaccharides (chain-length V to II) and N-acetylglucosamine (I) as described by Kamst et al. (3).

