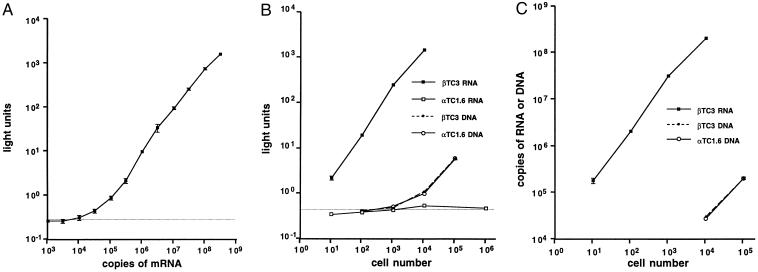
Figure 2.
Sensitivity and specificity of the mouse insulin II mRNA assay. (A) The bDNA assay was performed with probe set A (see Fig. 3A) and in vitro-transcribed mouse insulin II mRNA. Data points represent the mean ± SD of at least three independent samples. (B) The bDNA assay for RNA or DNA was performed with probe set A and the cell types indicated. Data points represent the mean ± SEM of at least three samples. (C) Data in B were converted from light units to copies of RNA with the standard curve in A or copies of DNA with a similar standard curve for DNA. The dashed horizontal line in A and B represents the background light emission in the absence of RNA.

