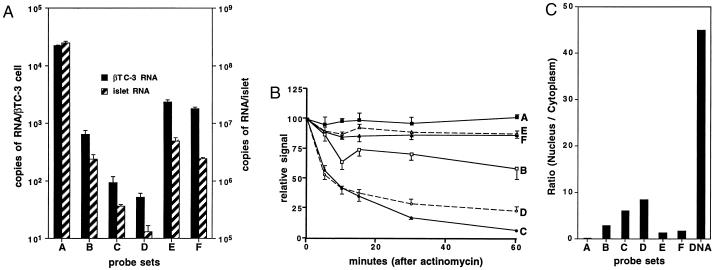
Figure 4.
preRNA levels in β cells. (A) The bDNA assay was performed with the probe sets shown and either βTC3 cells (solid bars) or cultured mouse islets (hatched bars). Data points represent the mean ± SEM of at least three samples. (B) The bDNA assay was performed with the probe sets shown and βTC3 cells cultured in the presence of actinomycin D for the times indicated. Data points represent the mean ± SEM of at least three samples. (C) The bDNA assay was performed with the probe sets shown and cytoplasmic or nuclear extracts from βTC3 cells. Each bar labeled A through F represents the ratio of nuclear to cytoplasmic RNA levels; the bar labeled DNA depicts the ratio of nuclear to cytoplasmic DNA levels using the A probe.

