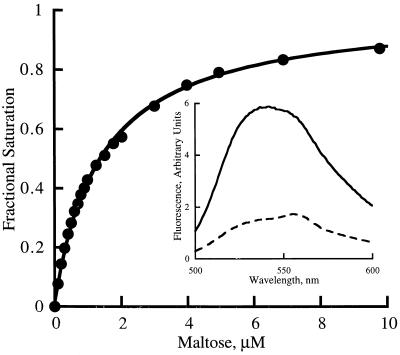
Figure 3.
Change in fluorescence of IANBD conjugated to the B3 variant upon maltose binding. The experimental points of the binding curve have been fit to Eq. 1. (Inset) Changes in the emission spectrum. – – –, No maltose; ——, addition of 1.3 mM maltose.

