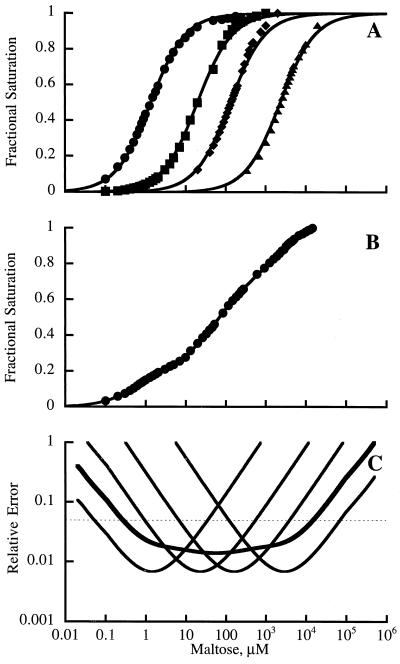
Figure 4.
Maltose binding curves for the B3 protein and three point mutants determined by measuring IANBD fluorescence. (A) Binding curves for each individual curve (fit to Eq. 1: B3, •; B3/W230A, ▪; B3/W62A, ♦; B3/W340A, ▴). (B) Response of a composite sensor with all four proteins mixed in equimolar proportions (total protein concentration, 2 μM; fit to Eq. 2). (C) Error analysis (dashed line indicates 5% error level) of the individual proteins (lightface lines, simulated with Eq. 3) compared with the aggregate error of the composite sensor (boldface line, simulated with Eq. 4) using the same total protein concentration.

