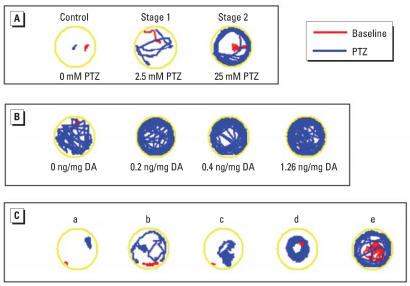
Figure 1.
EthoVision tracks (3-min duration) recorded before (baseline) and 15 min after PTZ addition. Lines show the track of fish movement. (A) Control (0.0 ng/mg DA) larvae exposed to 0, 2.5, and 25 mM PTZ, exhibiting seizure behaviors; no control larvae exhibited Stage III convulsions only. (B) Larvae demonstrating increased seizure activity across increasing DA concentrations when exposed to 5 mM PTZ. (C) Track examples of differences in PTZ (25 mM) response resulting from embryonic exposure to various prior DA doses: a) 1.26 ng/mg DA, stage III convulsions only; b) 1.26 ng/mg DA, increased movement originating from increased pectoral fin response only; c) 0.71 ng/mg DA, increased convulsive movement; d) 1.26 ng/mg DA, circular motion resulting from spinal deformities; and e) 0.4 ng/mg DA, increased movement in a similar pattern to, but without completing, a defined stage II seizure.

