Figure 1.
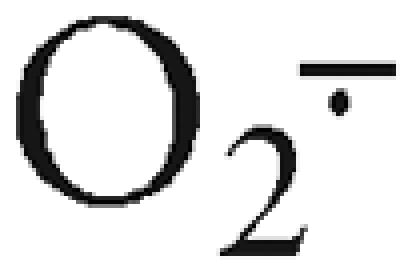
(A) The immediate production of intracellular H2O2 generated from the oxidative burst was measured in BV2 microglia with Image-iT LIVE Green. Cells were incubated (30 min, 37°C) in 25 μM Image-iT LIVE Green and exposed to P25. Significant increases of fluorescence first occurred in response to P25 (60 ppm; 1 min). (B) The production of
 resulting from interference with the mitochondria’s ETC was measured with MitoSOX Red. BV2 microglia, incubated in 2 μM (10 min, 37°C) showed a delayed but significant increase in fluorescence after 30-min exposure to ≥100 ppm P25. (C) Significant increases of caspase 3/7 activity were first seen by 6 hr in response to ≥40 ppm P25 and remained at this level for 24 hr. (D) Apoptotic loss of nuclear material, as measured with Hoechst stain, was first noted after 24 hr in response to P25 (≥100 ppm) and involved all concentrations by 48 hr.

