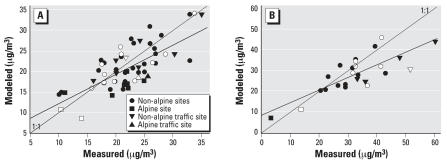
Figure 1.
Measured versus modeled annual PM10 concentrations for all Swiss sites including those in the SAPALDIA areas (in white) in (A) 2000 [SAPALDIA areas: y = 1.9 + 0.87x (R2 = 0.68, n = 15); all sites: y = 5.2 + 0.72x (R2 = 0.55, n = 57] and (B) 1990 [SAPALDIA areas: y = 8.6 + 0.6x (R2 = 0.45, n = 8); all sites: y = 8.6 + 0.61x (R2 = 0.63, n = 25)]. Traffic sites are within 20 m of a major road.

