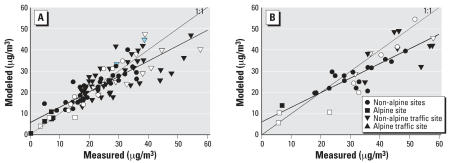
Figure 3.
Measured vs. modeled annual NO2 concentrations for all Swiss sites including those in the SAPALDIA areas (in white) in (A) 2000 [SAPALDIA areas: y = 3.3 + 0.81x (R2 = 0.79, n = 24); all sites: y = 5.8 + 0.73x (R2 = 0.72, n = 103)] and (B) 1990 [SAPALDIA areas: y = 1.8 + 0.78x (R2 = 0.80, n = 12); all sites: y = 6.0 + 0.69x (R2 = 0.75, n = 38)]. Two blue triangles are airport sites.

