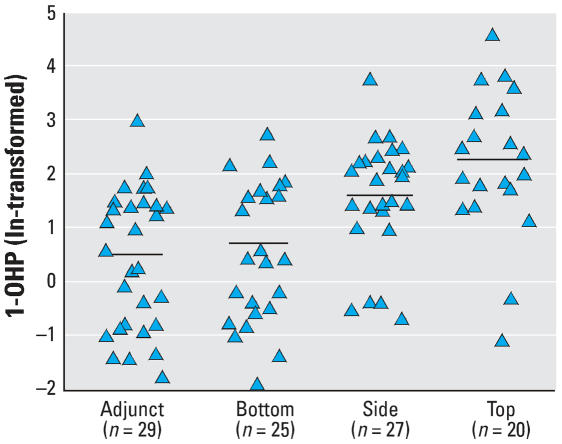
Figure 1.
Scatter plot of urinary 1-OHP by different external exposures to PAHs for adjunct work-places and bottom, side, and top of coke oven. Horizontal bars indicate the mean (ln-transformed). Urinary 1-OHP is highest among the workers exposed in the top (2.19 ± 1.36) of the coke oven, and lowest among the workers exposed in the bottom and in adjunct workplaces (0.58 ± 1.31 and 0.41 ± 1.28, respectively).

